
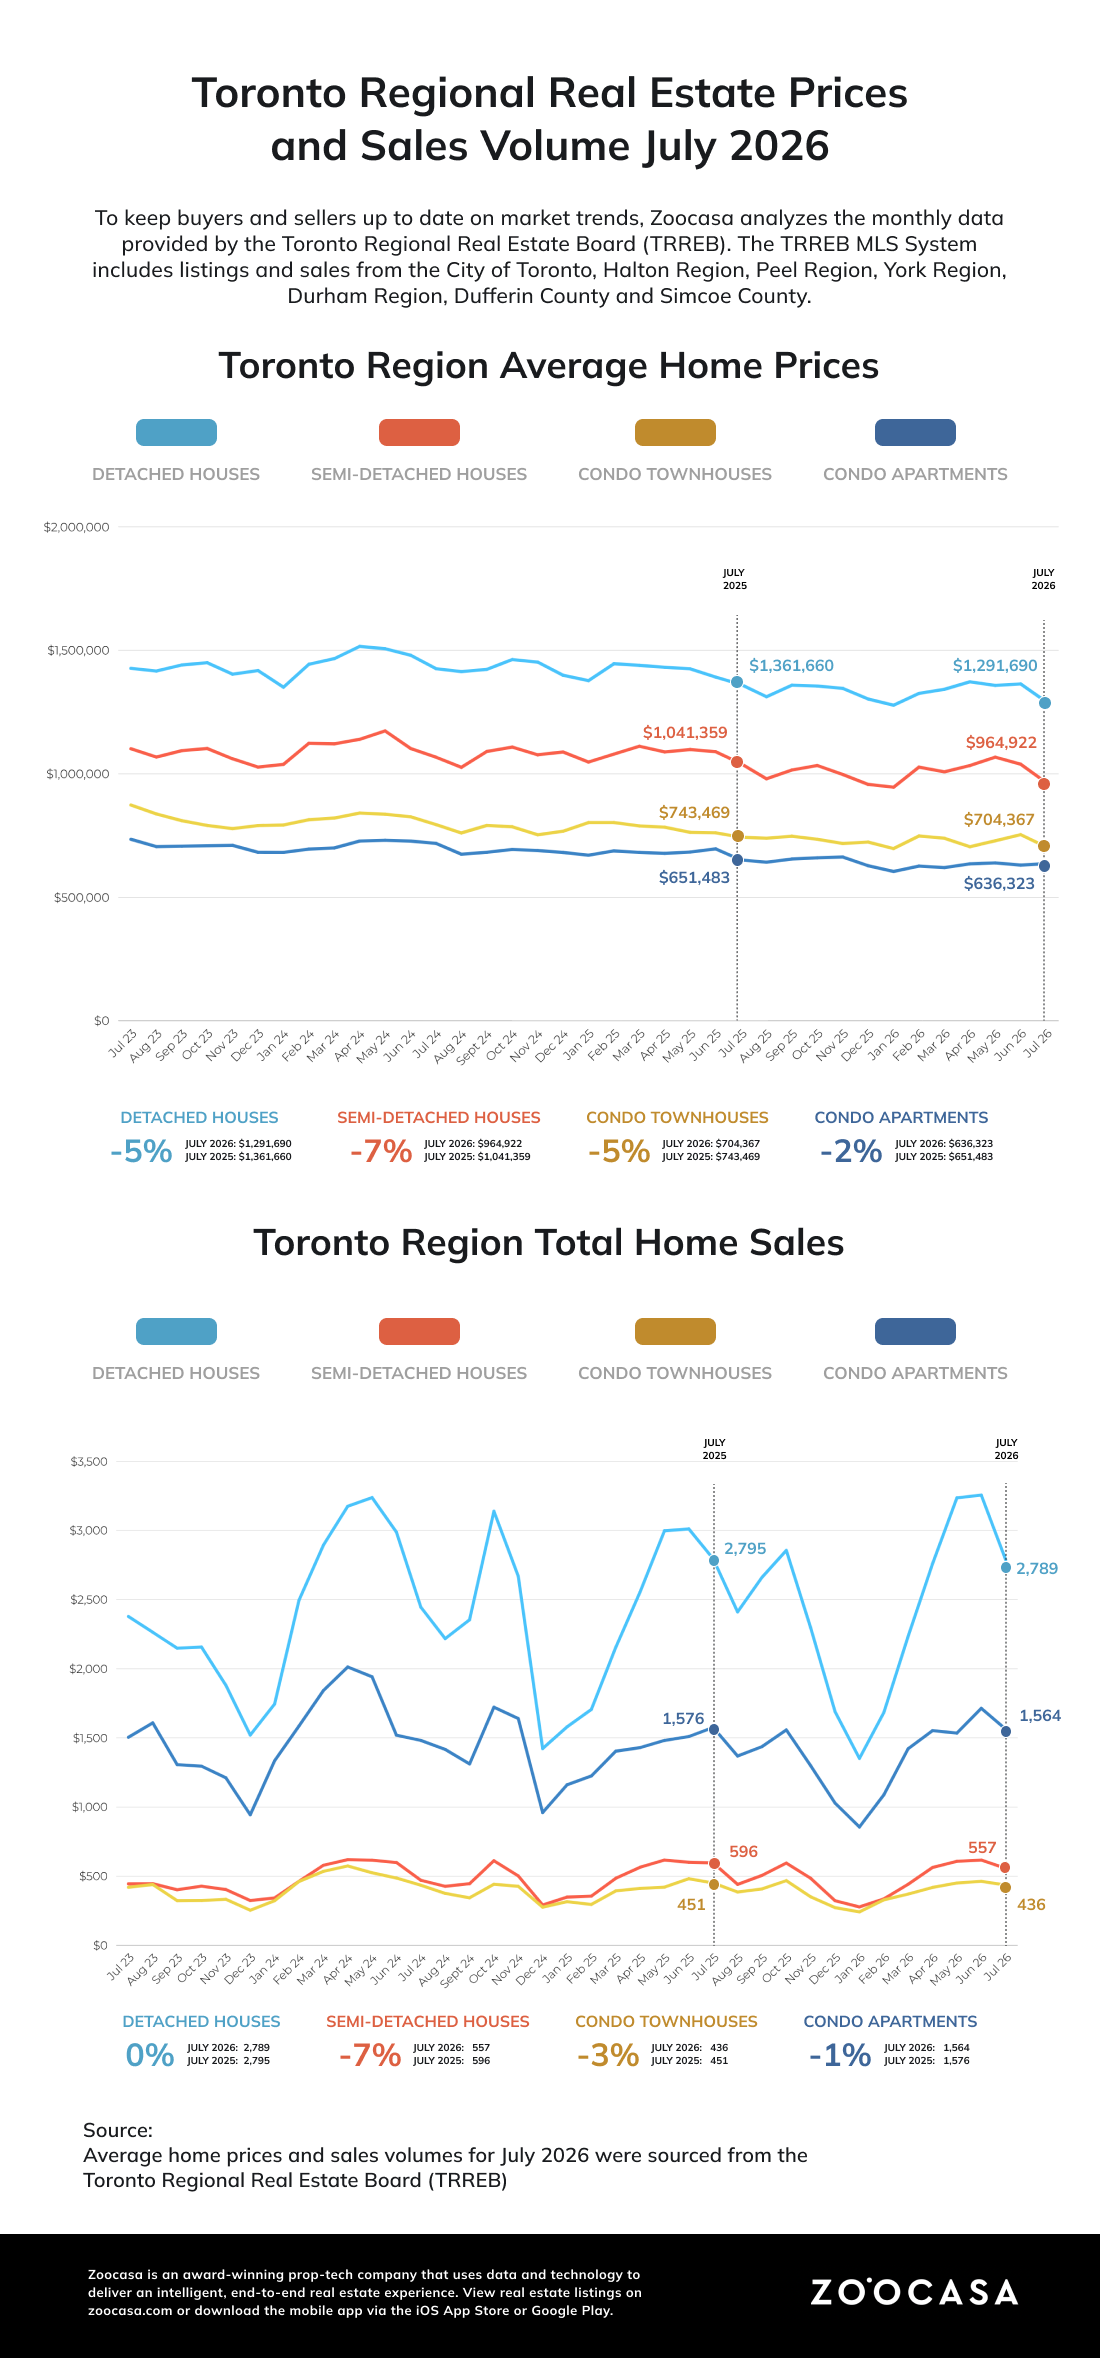
The Toronto real estate market showed signs of tightening in July 2026, with sales slightly down and new listings seeing a drop-off. Semi-detached homes were affected the most in July, with sales down almost 6% year over year and the average price down 7.4% to $964,922.
Townhouse sales experienced the second-largest change with a 2.7% decrease year over year, with prices down 3.9% to $817,213. Detached property sales increased 0.6%, while the average price went down 5.1% to $1.29 million. These market shifts indicate a changing tide in Toronto home sales, with buyers likely feeling the brunt of the impact.
“With sales accounting for a larger share of listings, buyers may find there is less room to negotiate moving forward,” TRREB President Daniel Steinfeld said. “If current trends continue, home prices could start to level off compared to last year.”

Suburban Sales Slow Across the Board
Sales took the largest hit in the GTA’s suburban areas, with all four segments seeing a decline in sales year over year. The largest drop was in the condo apartment market, with a 6.6% decline, followed by townhomes, which were down 6%.
Semi-detached home sales in the suburbs declined 5.3%, compared to the 6.8% decline seen in the city of Toronto. Detached homes in the suburbs were affected the least, with a 0.1% decline year over year.
The Durham Region saw the largest decrease in closed sales by volume, with 127 fewer sales this July, a 14.9% decline compared to the previous year. The second-largest drop was in the Halton Region, with a 4.6% decrease in sales year over year.
Overall, the decline in sales paired with fewer listings could mean that buyers have less room to negotiate in the coming months.
Prices Take a Dive in July
Prices fell across all home types in every segment of the market in July compared to the previous year, with the average price of $1 million being a 4.5% decline from July 2025.
Semi-detached home prices dropped the most at 7.4% down year over year across all of the Toronto region, and 9.9% down in the city of Toronto. When it came to the suburbs, the largest price difference was in the detached home market, with a 6.7% decline.
Simcoe County saw the largest price decrease by dollar volume, with the average home price falling $160,351 year over year. This was almost double the next-largest loss seen in the York Region, which was about an $88,000 decline.
Prices already trending lower could mean that sellers are less likely to budge on listing prices moving into the fall, especially if they’ve already lowered their price previously.
New Listings Decline the Most in Central Toronto Area
One of the most significant findings from July was the decrease in new listings, which signals a tightening Toronto housing market. Across the Toronto region, new listings were down 17.8% in July year over year, with over 3,000 fewer listings added to the market.
The largest decrease in listings by volume was in Toronto, which was down 1,028 year over year, or about 17%. Additionally, the Peel and York regions were each down 18.7% year over year. Simcoe County listings decreased 21%, the highest of any Toronto region.
“Removing remaining municipal roadblocks to attainable housing is a pressing issue in the GTA and Simcoe County,” TRREB CEO John DiMichele said. “Restrictive zoning, outdated rules, high taxes and fees, and approval delays are making housing more expensive and are key issues in the upcoming municipal election. They add tens of thousands of dollars to the cost of every home and need to be reformed.”
The smallest decline in new listings was in Dufferin County, which saw an 11% decline year over year.
Homes Spending More Time on the Market
On average, homes spent more time on the market in July compared to the previous year. The average listing days on market (LDOM) was 6.7% higher than last July, while the average property days on market (PDOM) was up 12.5%.
LDOM tracks a single listing, while PDOM tracks a property from the first time it is listed to when it is sold. The Halton Region stands out as having the highest increase in its LDOM and PDOM, both of which increased by 5 days year over year. On the other hand, Dufferin County was the only market to see an LDOM decrease, with 6 fewer days on market this July.
Overall, the market is slowing down, especially for the Halton Region. This means sellers may have more opportunities to take their time home shopping and finding the best fit for them.
Possible Upturn on Horizon with Economic Conditions Improving
Although sales slowed and new listings dropped, experts at TRREB believe the Toronto area could be in for a bustling market this fall. Toronto employment grew 0.9% in July, while unemployment dropped 7.2%. Additionally, the Bank of Canada held steady on its rates for the sixth time in a row.
“While uncertainty about the economy and borrowing costs persists, recent news has been more positive than expected,” TRREB Chief Information Officer Jason Mercer said. “The latest readings on economic growth and jobs surprised to the upside. This could help bolster consumer confidence and prompt an uptick in home purchases in the months ahead, especially if home prices stabilize as we move through the fall.”
Here’s a look at how listings, sales, and inventory changed from last month across GTA markets.
City of Toronto: Buyer’s Market
- New Listings: 4,980 (-18.3% m-o-m)
- Sales: 2,242 (-8.2% m-o-m)
- Active Listings: 9,310 (-7.3% m-o-m)
- Months of Inventory: 4.6 (-2.1% m-o-m)
Peel Region: Buyer’s Market
- New Listings: 2,875 (-12% m-o-m)
- Sales: 1,053 (-9.8% m-o-m)
- Active Listings: 5,055 (-2.6% m-o-m)
- Months of Inventory: 5.0 (-2% m-o-m)
York Region: Buyer’s Market
- New Listings: 2,764 (-16.1% m-o-m)
- Sales: 1,063 (-17.5% m-o-m)
- Active Listings: 5,179 (-2.3% m-o-m)
- Months of Inventory: 5.0 (-2% m-o-m)
Halton Region: Buyer’s Market
- New Listings: 1,503 (-18.6% m-o-m)
- Sales: 682 (-13.1% m-o-m)
- Active Listings: 2,659 (-5.9% m-o-m)
- Months of Inventory: 4.2 (-2.3% m-o-m)
Durham Region: Balanced Market
- New Listings: 1,719 (-16.1% m-o-m)
- Sales: 725 (-14.6% m-o-m)
- Active Listings: 2,579 (-2.2% m-o-m)
- Months of Inventory: 3.4 (0% m-o-m)
Looking to find a home in the Toronto area? Zoocasa can help. Start your search today!