

Home sales across Canada increased for the fourth consecutive month in July, according to the Canadian Real Estate Association’s (CREA) latest report. Nationally, home sales were up 0.5% month over month in July, while new listings declined 1.6% month over month, the third drop in a row.
“At the national level, July’s housing data was a carbon copy of the June numbers, with home sales edging up a little further, listings down, and prices remaining stable,” CREA’s Senior Economist Shaun Cathcart said. “The more interesting story over the last few months has been below the surface of the headline national numbers, where markets across the country are generally moving back towards balance.”
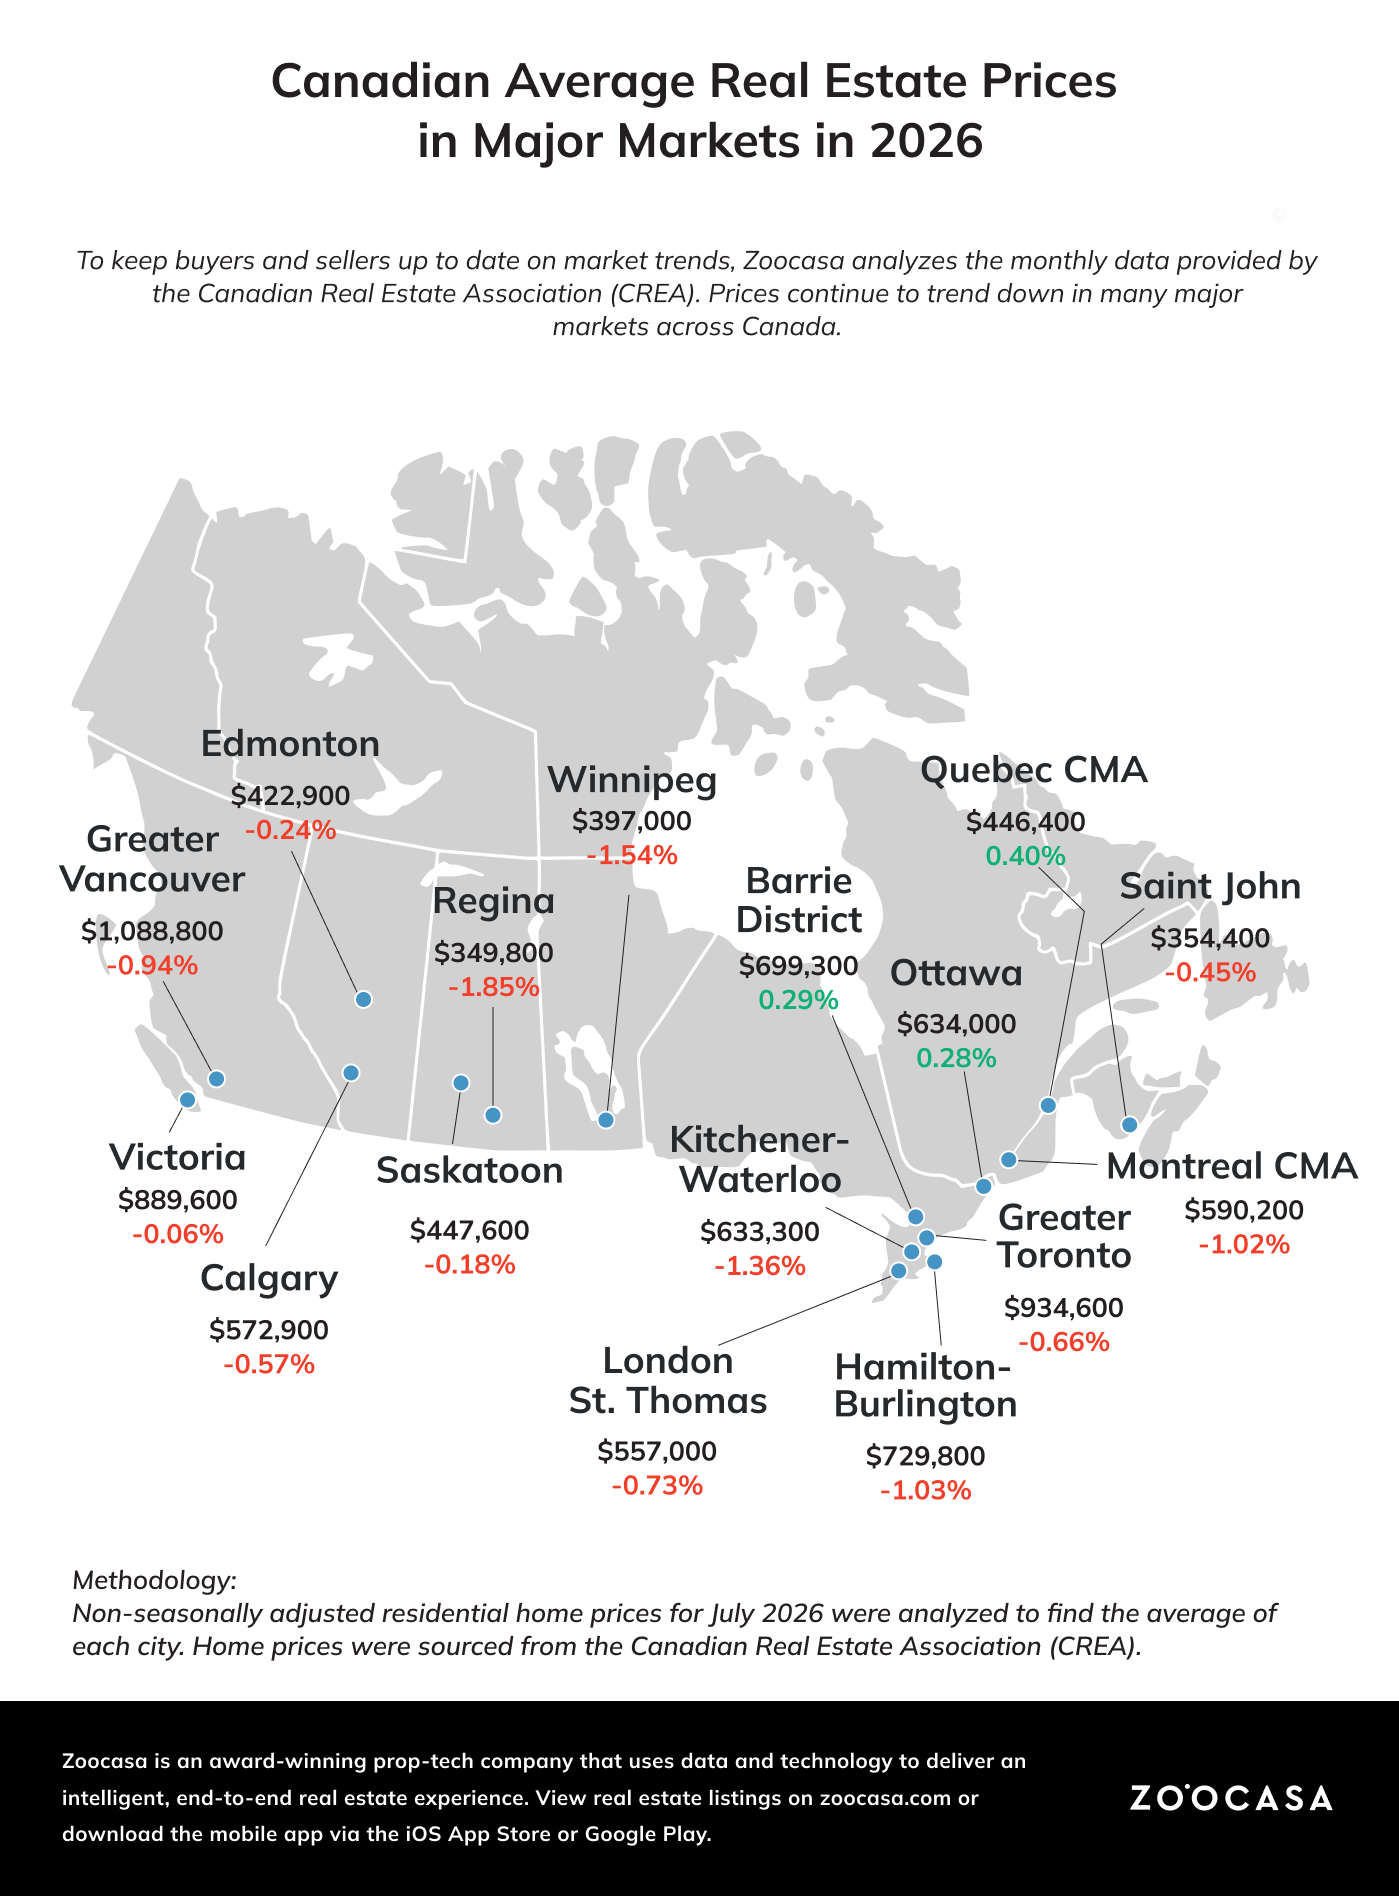
The drop in new listings and increase in sales pushed the sales-to-new-listings ratio from 50.2% in June up to 51.3% in July, with values between 45% and 65% considered balanced. Overall, several regions are inching toward balanced market conditions, which could bring more buyers into the fold this fall.
“The ongoing shift towards a more normal balance between supply and demand in so many markets across Canada is good news for buyers, whether that means not having to worry about your new home falling in value, or not feeling pressured to make a decision due to competing offers,” CREA Chair Garry Bhaura said.
Prices Fell in 62% of Canadian Regions
One of the most notable trends coming out of July was the price decrease seen in home prices, with 62% of Canadian regions, or 37 of 59 regions, seeing price declines month over month in their benchmark prices.
Zooming in, the largest price decrease was in Mississauga, with a 3% decline month over month. Simcoe & District also saw a 2.4% decrease month over month. On the other hand, 21 submarkets experienced price increases, with the largest provincial benchmark price increase in Quebec CMA at 0.4%.
Nationally, the average price decreased 3% from June to July, going from $696,078 in June down to $674,819.
Year over year, the national average price was up 0.2% in July, with Regina seeing the largest y-o-y increase at 13%, followed by Sherbrooke CMA at 11.1%. The largest y-o-y declines were in London and St. Thomas, down 7.2%, followed by Windsor-Essex, down 7%.
Overall, the month-over-month price declines are indicative of the ongoing market correction that’s underway, meaning buyers are less likely to feel the pressure of competing offers or bidding wars. Even so, the slight increase in average prices y-o-y are likely results of inflation and gradual property appreciation that buyers can continue to expect.
Sales Activity Decreased 5% Year-Over-Year
Western and central Canadian provinces saw the most consistent decreases in sales activity, while eastern provinces saw mixed results but the largest singular drop.
For western provinces, Edmonton, Regina and Saskatoon saw the largest decreases, at 11%, 12.2% and 11.4%, respectively. The largest drop among central provinces was in Thunder Bay, which experienced a 14.7% decline in sales.
In eastern Canada, a handful of areas actually saw sales activity increase, with Saguenay leading the pack at 16.2% higher sales year over year. Trois Rivières CMA saw the second-highest increase with 12.6% more sales, followed by an 8.2% increase in Newfoundland & Labrador.
Despite this, eastern Canada also saw some of the largest drops in sales. Gatineau CMA saw the largest decrease in sales across all of Canada, with a 15.7% decline. Similarly, Saint John sales declined 12.5% and Montreal CMA sales dropped 10%.
Paired with lower prices month over month, the decreased sales indicate more breathing room for buyers and potential room to negotiate going into the fall.
New Listings Took a Dive in July
In line with both declining sales and prices, new listings also decreased broadly across Canada in July.
British Columbia saw the highest single decline, with new listings in Fraser Valley dropping 22.3% year over year. The Greater Vancouver area also experienced a 14.3% decline, the third-highest countrywide.
The other pocket of Canada that was hit hardest was Ontario, specifically Toronto and the surrounding area. New listings in the Greater Toronto area dropped 17.8% year over year, while Hamilton-Burlington listings declined 13.6%. Kitchener-Waterloo listings also dropped 12.9%, and the Niagara Region saw an 11% decline.
Despite this, some areas did see an increase in new listings, including Windsor-Essex with a 28.3% increase and Gatineau CMA with a 19.5% increase.
Overall, the decline in new listings resulted in the sales-to-new-listings ratio edging up slightly in July to 51.3%, up from 50.2% in June and 49.3% in May. This trend toward a more even market between buyers and sellers means sellers likely don’t need to worry about their homes losing value in the coming months, and buyers have more time to shop around.
What A Balancing Market Means for Buyers and Sellers
When the sales-to-new-listings ratio punched in over 50% in June, it was the first time it had happened this year. With that movement holding steady in July, buyers are in for a new normal heading into fall that offers more consistency and predictability in their home search.
The same is true for sellers–although sales are down, pricing hasn’t taken too large of a hit across most provinces, with some even seeing increases. This means both buyers and sellers will have an opportunity this fall to make their moves in the housing market without fear of sudden changes impacting their prices or ability to buy.
“No matter where you are in Canada, more moderate housing market conditions can be expected to continue to bring buyers off the sidelines going forward,” Bhaura said. “If you are among that group, or if you are thinking about selling a property in a more normal market, the first step is to get in touch with a REALTOR® in your area.”
Want to know more about how these changes affect your home plans? Zoocasa has agents who can help. Reach out today to learn more.