

Sales across the Greater Toronto Area saw their second-largest decline this year in September, according to the Toronto Regional Real Estate Board’s (TRREB) latest report.
There were 500 fewer homes were sold in September compared to the previous year, resulting in a 9% decline. Sales dropped across all home types, with the largest year-over-year decrease in townhomes (down 12.8%), followed by detached homes (down 8.7%). Prices were also lower across all segments, with condo apartments leading the charge at 7.7% down, followed by detached homes at 5.1% down.
On a month-over-month basis, home sales decreased from 5,000 in August to 4,977 in September, while prices increased by about 1.3%.
“We know there is substantial pent-up demand in the GTA, with many households fully intending on purchasing a home in the months ahead,” TRREB Chief Information Officer Jason Mercer said. “These would-be homebuyers want to take advantage of today’s more affordable housing market, but they need to be confident that their employment situation will remain solid and inflation will not put pressure on borrowing costs over the long term.”
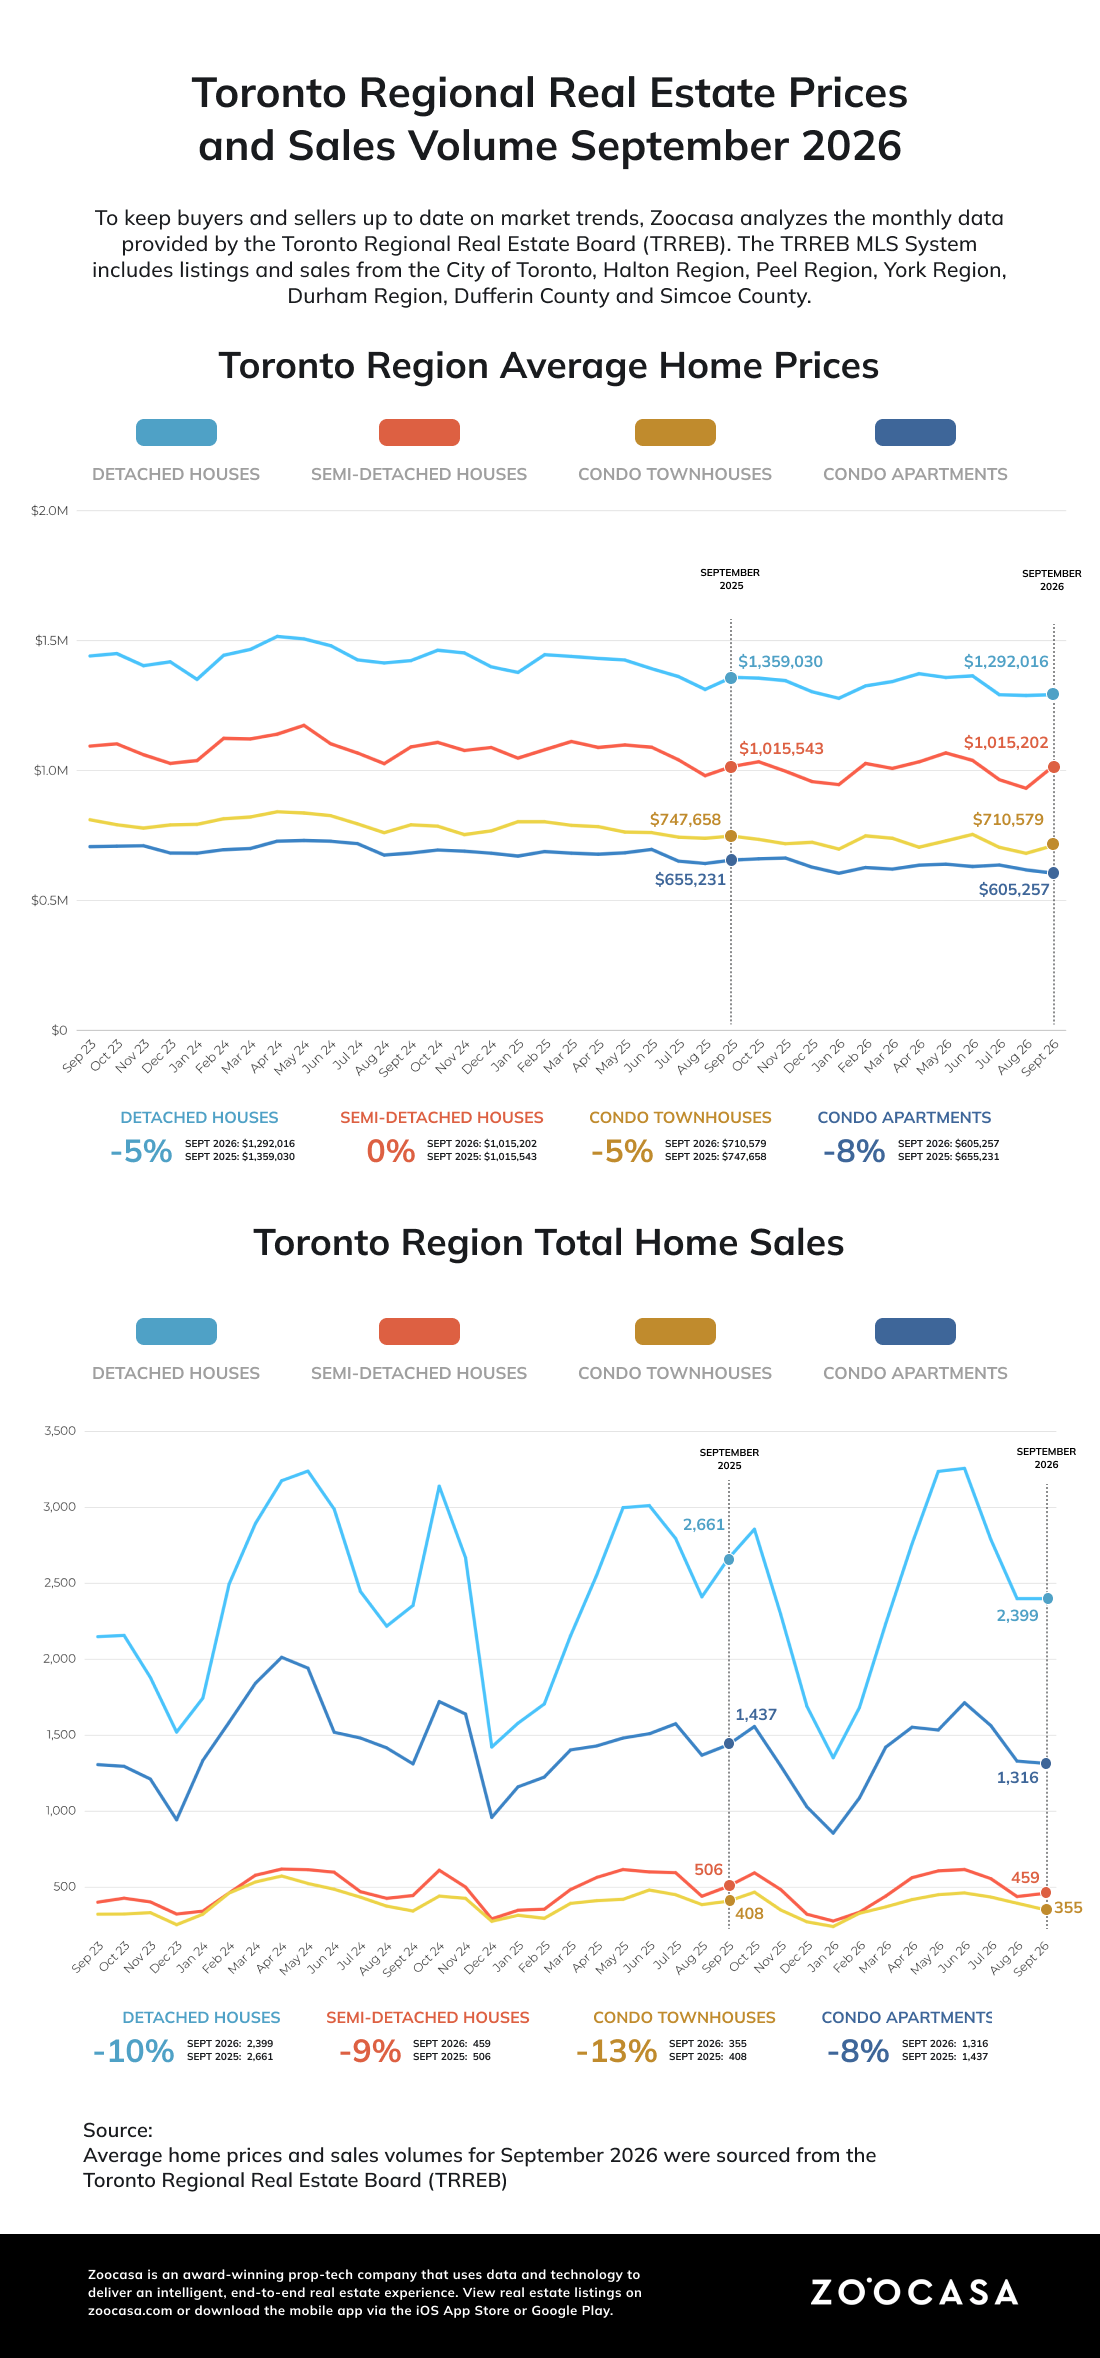
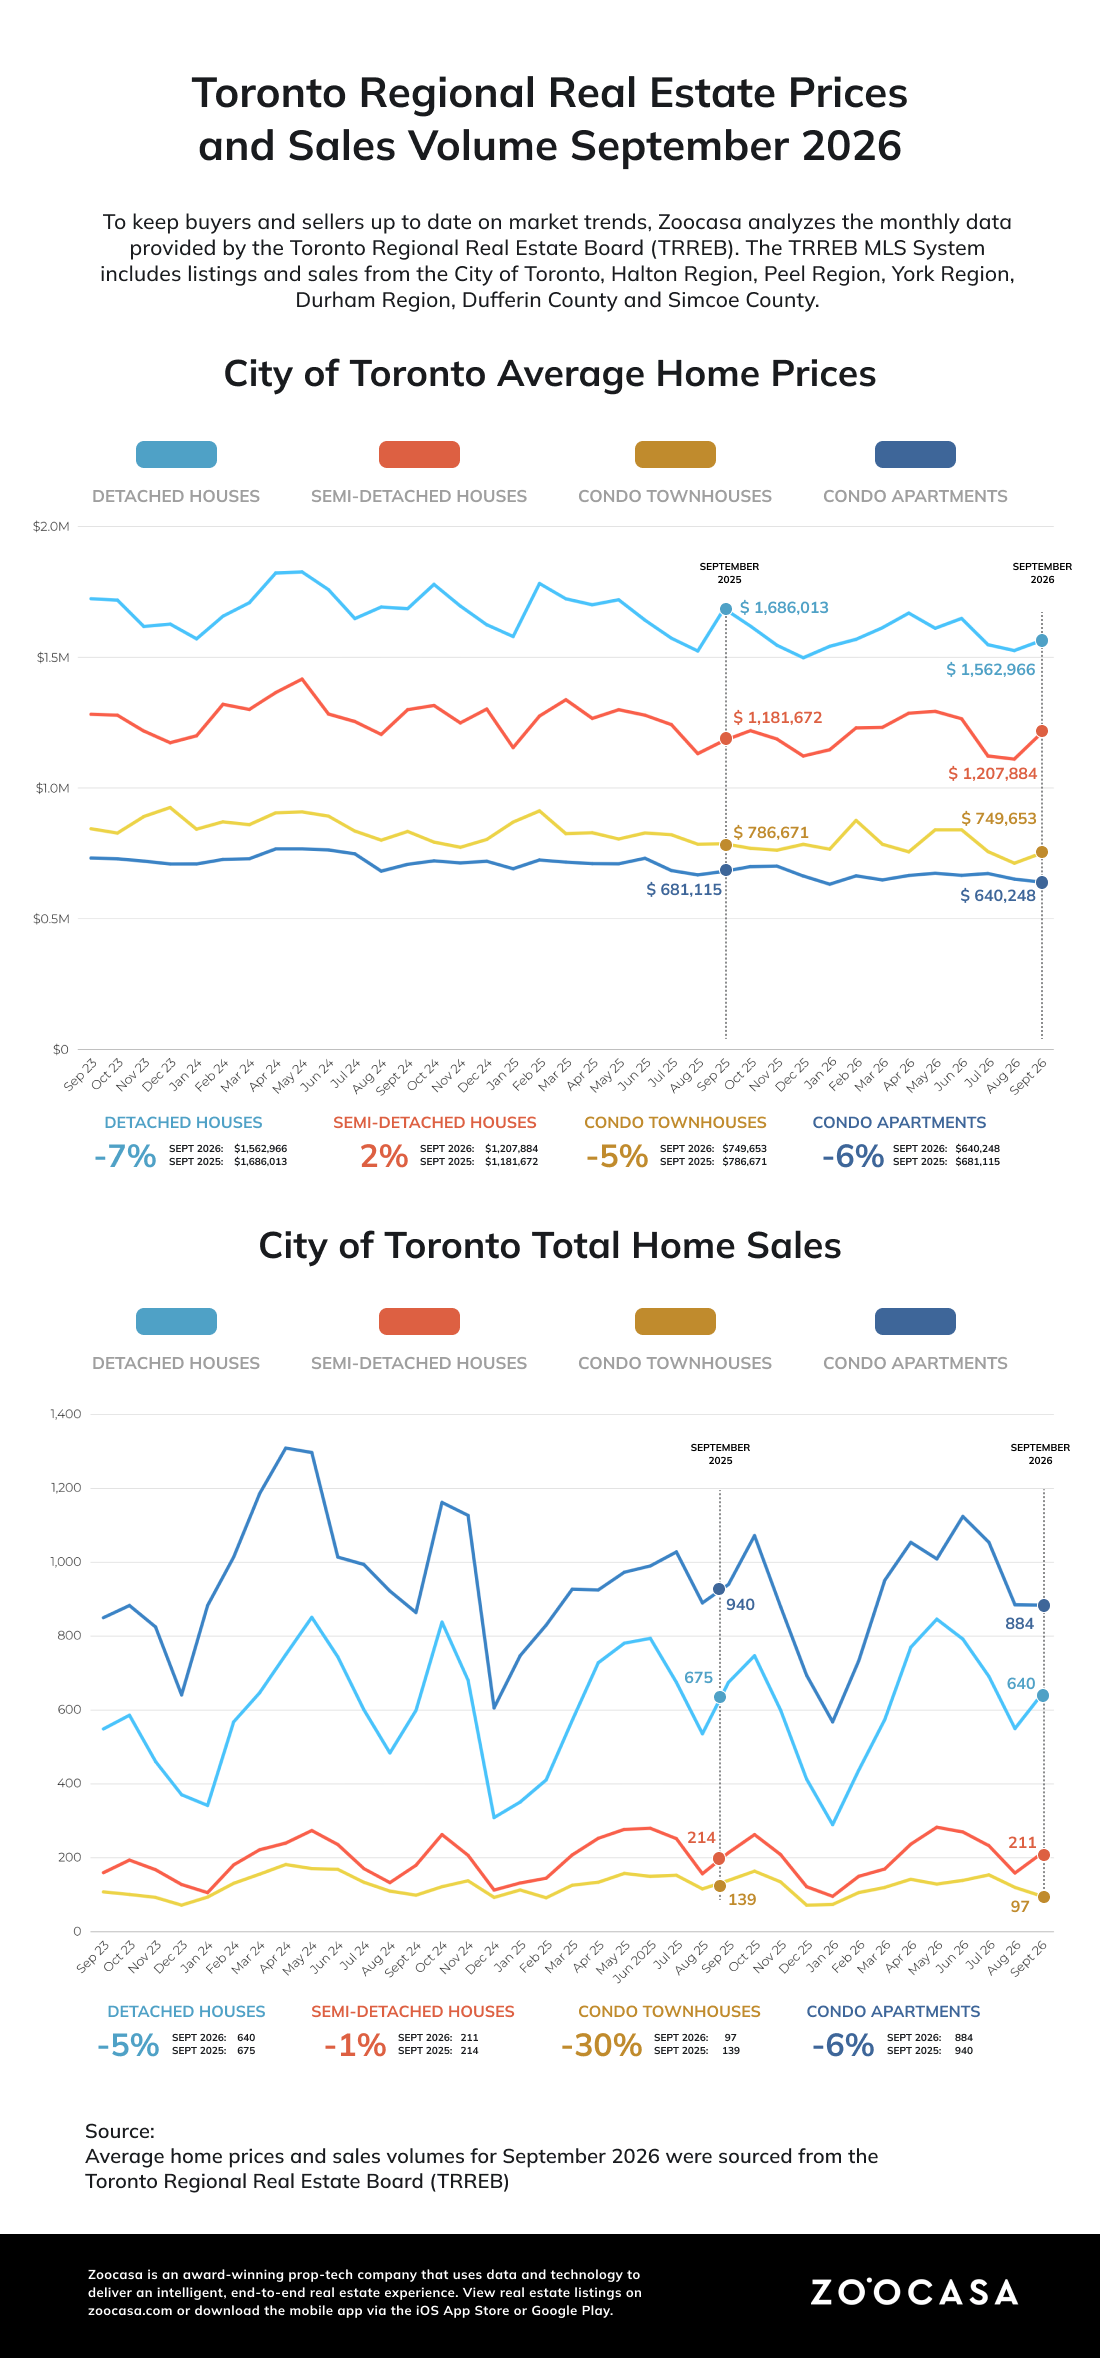
Durham and York Region Sales Take a Dive
While sales were down across all segments of the GTA, the Durham Region has seen some of the largest shifts in the last few months.
Year over year, Durham home sales were down 21.9% in September, with 155 fewer sales. That’s the highest sales drop by volume and the second-highest by percent change, just behind Dufferin County at 23.3% down year over year.
Year to date, Durham has experienced the largest sales drop-off of any region in the GTA, with 645 fewer sales compared to the previous year at this time.
The York Region saw the second-largest losses by volume both year over year (down 139) and year to date (down 255).
Overall, these figures show that sales momentum is reaching a halt in the northern and eastern GTA.
Central Toronto Sales Price Declines
Sales prices also saw a broad decline across the GTA. The city of Toronto had the largest price decrease at $59,598, down 5.1% year-over-year. The largest price decrease within the city was in Central Toronto, where prices decreased 6% year over year to $1,102,955. The western part of the city wasn’t far behind, with prices down 5.4% year over year to $985,920.
The Peel Region had the second-largest decline in the GTA at $52,594, down 5.4% year over year. The largest decline was in Brampton, where prices were down 8% year over year to $854,322. Caledon and Mississauga were roughly equal in the price percentage decreases year over year at 4.2% and 4.1%, respectively.
Beyond the GTA, Simcoe County experienced a $112,049 drop-off in its year-over-year average sales price in September, a decrease of about 12.1% across its 187 sales.
TRREB’s report points to economic uncertainty, inflation and increased borrowing costs as the cause for September’s market slowdown, although the numbers show market momentum has been dropping off since the start of summer.
Listings Decline in the Western GTA
The percent change in new listings across the GTA has decreased every month so far in 2026, with September seeing a 14.4% decline year-over-year. For the second consecutive month, the western GTA faced the largest slowdown in both new and active listings.
In the Peel Region, new listings decreased 25.5%, while Halton listings decreased 17.4%. Taken together, that’s about 1,300 fewer new listings entering the market. Listings in York and Durham hovered around 12% down, while the city of Toronto saw the largest decline at around 9%.
Additionally, active listings have been down in the GTA for several months, and ended up 9.3% down year over year in September. The Peel Region saw an 18.6% decline in active listings alongside a 16% decrease in Halton, resulting in nearly 1,600 fewer listings on the market this fall.
With fewer new listings and active listings, homebuyers will be facing fewer choices this fall. However, the downward pressure on pricing could mean that buyers on the sidelines will have more room for negotiation.
Building for the Future
Despite the level of uncertainty at the international scale, there are some positive signs for the economy at the national level. Real GDP growth was up 3.3% in the second quarter, while employment in Toronto grew 1.7% in August. Additionally, unemployment and inflation rates have been relatively stable.
“With trade uncertainty and tariffs continuing to affect Canada’s economy, maintaining a strong housing sector is critical to supporting consumer confidence, economic growth, and the significant spin-off spending generated by every MLS® transaction,” TRREB CEO John DiMichele said.
TRREB officials said the upcoming elections could be critical when it comes to the housing outlook across the GTA in the coming years.
“Housing is one of the biggest issues on voters’ minds, and the upcoming municipal election will help shape housing policy across the GTA and Simcoe County for the next four years,” TRREB President Daniel Steinfeld said. “The decisions our next mayors and councillors make on affordability, housing supply and the costs associated with buying a home can also influence buyer demand and confidence in the market.”
City of Toronto: Buyer’s Market
- New Listings: 6,521 (+55.3% m-o-m)
- Sales: 1,937 (+9.6% m-o-m)
- Active Listings: 9,865 (+13.0% m-o-m)
- Months of Inventory: 4.6 (0.0% m-o-m)
Peel Region: Buyer’s Market
- New Listings: 2,661 (+15.8% m-o-m)
- Sales: 936 (-0.4% m-o-m)
- Active Listings: 4,631 (-1.6% m-o-m)
- Months of Inventory: 4.9 (0.0% m-o-m)
York Region: Buyer’s Market
- New Listings: 3,106 (+30.0% m-o-m)
- Sales: 893 (-8.0% m-o-m)
- Active Listings: 5,168 (+5.1% m-o-m)
- Months of Inventory: 5.0 (0.0% m-o-m)
Halton Region: Balanced Market
- New Listings: 1,733 (+44.3% m-o-m)
- Sales: 502 (-12.1% m-o-m)
- Active Listings: 2,625 (+8.8% m-o-m)
- Months of Inventory: 4.2 (0.0% m-o-m)
Durham Region: Balanced Market
- New Listings: 1,834 (+28.9% m-o-m)
- Sales: 552 (-8.3% m-o-m)
- Active Listings: 2,622 (+6.3% m-o-m)
- Months of Inventory: 3.5 (+2.9% m-o-m)