
Current interest rates in the U.S. have reached a high not seen since 2001, with the overnight federal funds rate now at 5.33%, resulting in increased borrowing costs for homebuyers. On top of rising mortgage payments, American homebuyers are also contending with rising home prices. According to the latest data from the National Association of Realtors, the median national home price in August was $407,100 – a year-over-year increase of 3.9%.
Enjoying our content? Subscribe to our free weekly newsletter to get real estate market insights, news, and reports straight to your inbox.
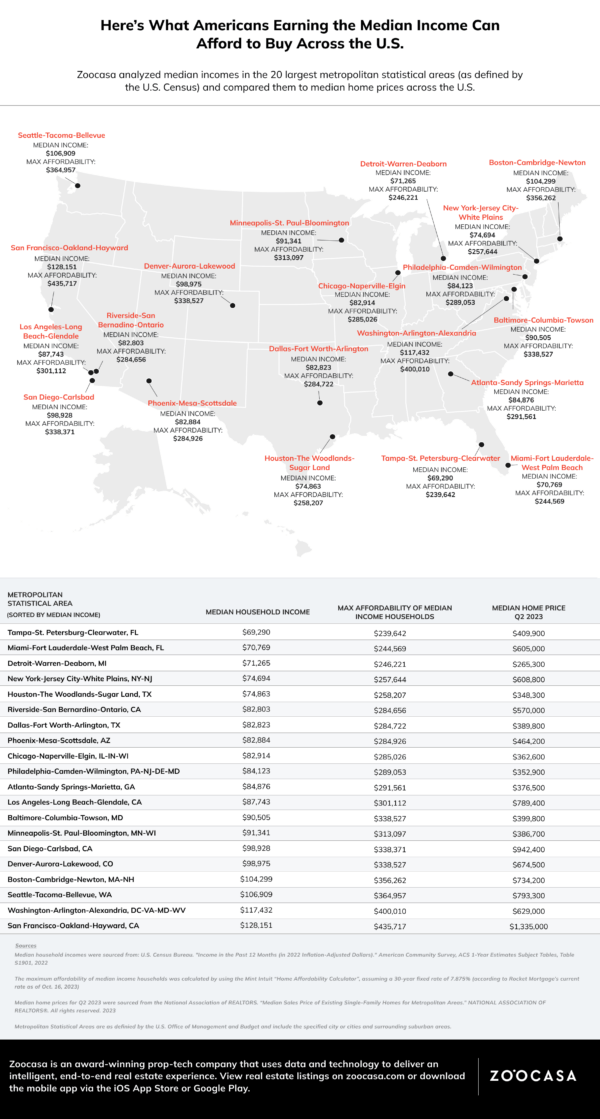
With affordability tightening, median-income earners may find themselves priced out of major markets. To find out what those earning the median income can afford, Zoocasa analyzed median incomes in 20 of the largest metropolitan areas in the U.S. according to the U.S. Census and calculated the maximum affordability for those cities and compared that to what the most recent median home price was in each according to Q2 2023 data from the National Association of Realtors.
Home Prices Out of Reach in Every Major Market
Buying a home in any major market right now will be challenging for those earning the median income as median home prices far exceed the max affordability in each city we included in this analysis. Especially in the most sought-after cities, like New York (New York-Jersy City-White Plains) and Los Angeles (Los Angeles-Long Beach-Glendale), where the gap between what median-income earners can afford and the median home price is more than $350,000.
Even in San Francisco (San Francisco-Oakland-Hayward), the city with the greatest median income of $128,151, a home is still out of reach. The median home price in San Francisco in Q2 2023 was $1,335,000 while the max affordability for median-income earners is much less at $435,717.
Washington D.C. (Washington-Arlington-Alexandria) had the next highest median income at $117,432 and a max affordability of $400,010 – still $228,990 short of what the median home price was in Q2 2023. Seattle (Seattle-Tacoma-Bellevue) followed with the third-highest median income and the third-highest median home price. Buyers in Seattle earning the median income of $106,909 may be able to afford a home up to a maximum of $364,957, while the median home price in Q2 2023 was $793,300.
Buyers Can Find the Greatest Affordability in the Midwest and East Coast
Despite the great disparity between median-income affordability and home prices, there are a few areas where the gap is less concerning. Detroit (Detroit-Warren-Deaborn) is the most affordable city with a difference of just $19,079 between max affordability of median income earners and the median home price. Detroit’s median home price of $265,300 is also the most affordable on our list and nearly $150,000 less than the national median. In addition, according to recent data from Chamber of Commerce, Detroit topped the list of cities with the most paid-off homes, with two-thirds of homeowners in the “Motor City” having completely paid off their homes.
Buyers in Baltimore (Baltimore-Columbia-Towson) earning the median income of $90,505 could afford to buy a home priced at $338,527 – just $61,273 shy of the median home price in Q2 2023, while buyers in Philadelphia (Philadelphia-Camden-Wilmington) earning the median income are $63,847 shy of the median home price.
Other cities with median home prices below the national median are Houston (Houston-The Woodlands-Sugar Land), Dallas (Dallas-Fort Worth-Arlington), Chicago (Chicago-Naperville-Elgin), Atlanta (Atlanta-Sandy Springs-Marietta), and Minneapolis (Minneapolis-St. Paul-Bloomington).
If you’re looking to enter one of these markets, it’s important to speak with a local realtor who can give you specific information and guidance about the local real estate market. Give us a call today to discuss your home-buying plans.
Methodology
Median household incomes were sourced from: U.S. Census Bureau. “Income in the Past 12 Months (in 2022 Inflation-Adjusted Dollars).” American Community Survey, ACS 1-Year Estimates Subject Tables, Table S1901, 2022
The maximum affordability of median income households was calculated by using the Mint Intuit “Home Affordability Calculator”, assuming a 30-year fixed rate of 7.875% (according to Rocket Mortgage’s current rate as of Oct. 16, 2023)
Median home prices for Q2 2023 were sourced from the National Association of REALTORS. “Median Sales Price of Existing Single-Family Homes for Metropolitan Areas.” NATIONAL ASSOCIATION OF REALTORS®. All rights reserved. 2023
Metropolitan Statistical Areas are as defined by the U.S. Office of Management and Budget and include the specified city or cities and surrounding suburban areas.