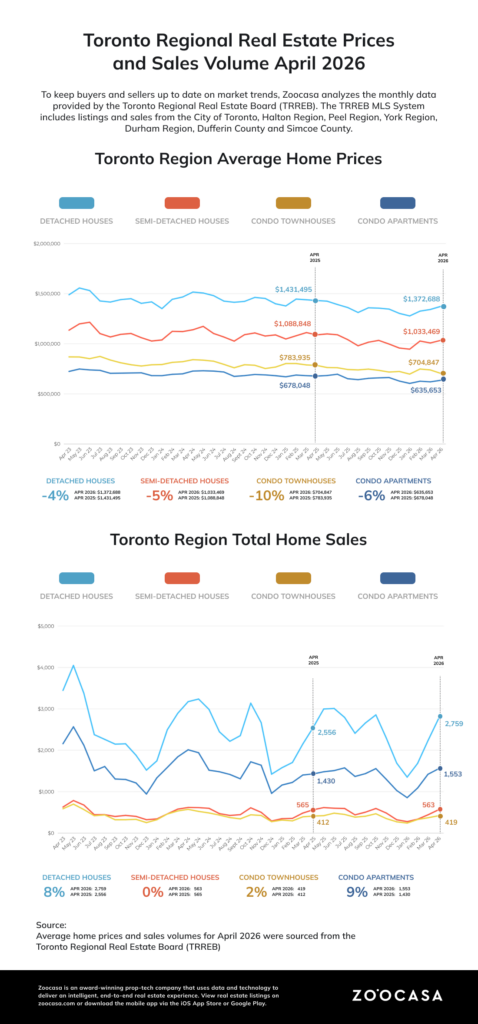
The Greater Toronto Area housing market picked up pace in April 2026, as buyers took advantage of lower prices and improved affordability this spring. According to the April Toronto Regional Real Estate Board report, 5,946 homes were sold, up 7% from April 2025, while new listings fell 9.3% year-over-year to 17,097. The average selling price across all home types softened by 4.9% annually to $1,051,969.
With borrowing costs down from last year and prices continuing to ease, more buyers found the confidence to step off the sidelines, though a substantial pool of pent-up demand remains.
“Lower home prices and borrowing costs over the past year have been a catalyst for some homebuyers this spring. However, we still have substantial pent-up demand in the marketplace. More certainty on the trade front and an easing in geopolitical tensions would result in further improvements in market activity,” said TRREB’s Chief Information Officer Jason Mercer.
Related: What a $55K–$85K Salary Gets You in Canada’s Housing Market Right Now

Detached Home Buyers Can Find Deals in Durham
Detached homes led the market in April, accounting for 46.4% of all sales with 2,759 transactions at a GTA-wide average price of $1,372,688. The median price came in at $1,165,000, highlighting that a significant share of buyers are still transacting below the headline average.
For buyers targeting detached homes under $1M, Durham Region continues to offer the most accessible options. Oshawa recorded 108 sales at an average of $789,622, followed by Clarington at $889,795 across 79 transactions. Ajax remained just below the $1M threshold, averaging $990,854 (66 sales), while Whitby has now moved slightly above that mark at $1,043,400 across 69 transactions.
Brampton remained the most active suburban market, with 225 sales at an average price of $1,018,564, outperforming Mississauga (187 sales, $1,364,097 average), Markham (110 sales, $1,511,813 average), and Vaughan (122 sales, $1,548,367 average). For buyers seeking more space at a relatively lower price point, Brampton continues to stand out.
No region captures the GTA’s price divide quite like York. King averaged $1,718,286 across just 14 sales, while Georgina averaged $781,475 across 43 transactions, illustrating a substantial gap within the same region. Newmarket ($1,142,017) and Stouffville ($1,482,557) offer mid-range alternatives for buyers looking to balance location and cost.
Within the City of Toronto, 770 detached homes sold at an average of $1,668,973. Toronto East was both the most active and the relatively more affordable segment, with 267 sales averaging $1,180,165 and 20 days on market. Toronto West saw 255 sales at $1,410,406, while Toronto Central remained the most expensive, with 248 transactions at an average of $2,461,095.
In terms of pace, Ajax and Whitby were among the fastest-moving markets at 21 days on market, followed by Burlington at 24 days. At the other end, King (43 days) and Brock (38 days) moved more slowly, offering buyers additional time to evaluate opportunities.
Related: Your Rent, Converted: City‑by‑City Rent Costs in Canada and the U.S. in 2026
Condos Under $500K Still Exist, But You’ll Need to Look East
A total of 1,553 condominium units were sold across the GTA in April at an average price of $635,653. Toronto continued to dominate activity, accounting for 68% of all transactions with 1,054 sales at an average of $665,507.
Within the city, the Downtown, Entertainment District, and Liberty Village neighbourhood led with 245 sales, averaging $679,200. Regent Park, St. James Town, and Corktown followed with 156 sales at $655,927. Toronto West recorded 208 transactions totalling $563,496, while Toronto East remained the most affordable segment, with 127 sales at an average price of $511,235.
Condo options under $500,000 remain available in Toronto, though inventory is limited. The most affordable neighbourhoods are concentrated in Scarborough’s east end, led by Malvern and Rouge at an average of $426,357, followed by Morningside, Woburn, and Bendale (E09) at $449,212. Condos in the Dorset Park and Kennedy Park neighbourhood sold for an average of $456,653, with Steeles, Tam O’Shanter, and Sullivan at $470,550, and West Hill and Centennial Scarborough at $487,529.
Related: How Long Would It Take to Save a Down Payment in Canada’s 10 Largest Cities?
April’s Most Active Price Brackets: $500K Condos, $1M Detached, $800K Towns
After detached homes with 46% of sales, the condo market saw the most activity in April, with nearly one in four condo sales falling in the $400,000–$599,999 range. Detached home buyers gravitated toward the $1,000,000–$1,249,999 bracket, which led with 535 sales, closely trailed by the $900,000–$999,999 range. Townhouse demand, meanwhile, clustered firmly in the $700,000–$899,999 budget.
“We have experienced an uptick in home-buying activity so far this spring. Buyers have taken advantage of more affordable housing market conditions on the back of lower home prices,” said TRREB President Daniel Steinfeld. “If market conditions continue to tighten and home prices level off, this could be a signal to intending homebuyers who remain on the sidelines.”
Here’s a look at how listings, sales, and inventory changed from last month across GTA markets.
City of Toronto: Buyer’s Market
- New Listings: 6,136 (+15.7% m-o-m)
- Sales: 2,312 (+20.8% m-o-m)
- Active Listings: 9,260 (+13.1% m-o-m)
- Months of Inventory: 4.9 (-0.1 m-o-m)
Peel Region: Buyer’s Market
- New Listings: 3,158 (+19.5% m-o-m)
- Sales: 996 (+13.7% m-o-m)
- Active Listings: 4,641 (+17.5% m-o-m)
- Months of Inventory: 5.4 (-0.1 m-o-m)
York Region: Buyer’s Market
- New Listings: 3,284 (+20.3% m-o-m)
- Sales: 994 (+12.1% m-o-m)
- Active Listings: 4,993 (+19.5% m-o-m)
- Months of Inventory: 5.4 (-0.1 m-o-m)
Halton Region: Balanced Market
- New Listings: 1,856 (+19.1% m-o-m)
- Sales: 693 (+24.6% m-o-m)
- Active Listings: 2,675 (+16.0% m-o-m)
- Months of Inventory: 4.5 (-0.1 m-o-m)
Durham Region: Seller’s Market
- New Listings: 1,923 (+22.0% m-o-m)
- Sales: 708 (+10.6% m-o-m)
- Active Listings: 2,331 (+22.7% m-o-m)
- Months of Inventory: 3.5 (0.0 m-o-m)