
After a slower August, the Greater Toronto Area (GTA) housing market regained momentum in September as both buyers and sellers returned to the market. Across all TRREB regions, 5,592 homes were sold, representing a 7.3% month-over-month increase and an 8.5% year-over-year increase. The improvement in sales reflects renewed confidence among buyers who had been waiting out the quieter summer months.
Sellers also re-entered the market in greater numbers. New listings surged 37.2% from August, reaching 19,260 across all TRREB areas in September, providing buyers with more options and helping to maintain balanced conditions across the region. This influx signaled that many homeowners saw September as an opportune time to capitalize on fall market demand.
Prices also trended upward. The average home price in the GTA increased 3.6% month-over-month, or approximately $40,000, reaching $1,059,377 in September. The rise in prices alongside growing inventory suggests that demand remained steady, supported by improving affordability and easing borrowing costs.
416 Core Leads the Fall Rebound
Toronto’s core market led the early fall rebound, showing renewed buyer confidence and stronger activity across key housing segments. Home sales increased 16% month over month, rising from 1,779 in August to 2,063 in September, while the average price jumped 9.9% to $1,089,918.
Detached homes helped drive this momentum, with 675 sales, supported by 2,377 new listings and 2,938 active listings. Detached properties spent an average of 25 days on the market.
The condo apartment segment also strengthened in Toronto, with 940 sales at an average price of $681,115. Meanwhile, 3,431 new listings entered the market, and the number of active listings increased to 5,971. However, units continued to move at a slower pace, averaging 39 days on the market—a sign that elevated inventory is still giving buyers more time and leverage in Toronto’s high-density housing sector.
Overall, September marked a seasonal turning point for Toronto’s housing market, with activity picking up across all home types and a renewed sense of balance heading into the final quarter of the year.

Townhouses Lead Toronto’s September Sales Surge
In September 2025, a total of 506 townhouses were sold across the GTA. Meanwhile, townhouses in the 416 area posted the largest annual sales gain, jumping 39.2% year-over-year as more buyers sought homes with more space within their budget. Semi-detached homes also experienced strong growth, with sales increasing by 17.6% in the 416 area and 6.6% in the 905 area, indicating steady demand for mid-range housing.
Detached Homes Remain the Market Driver
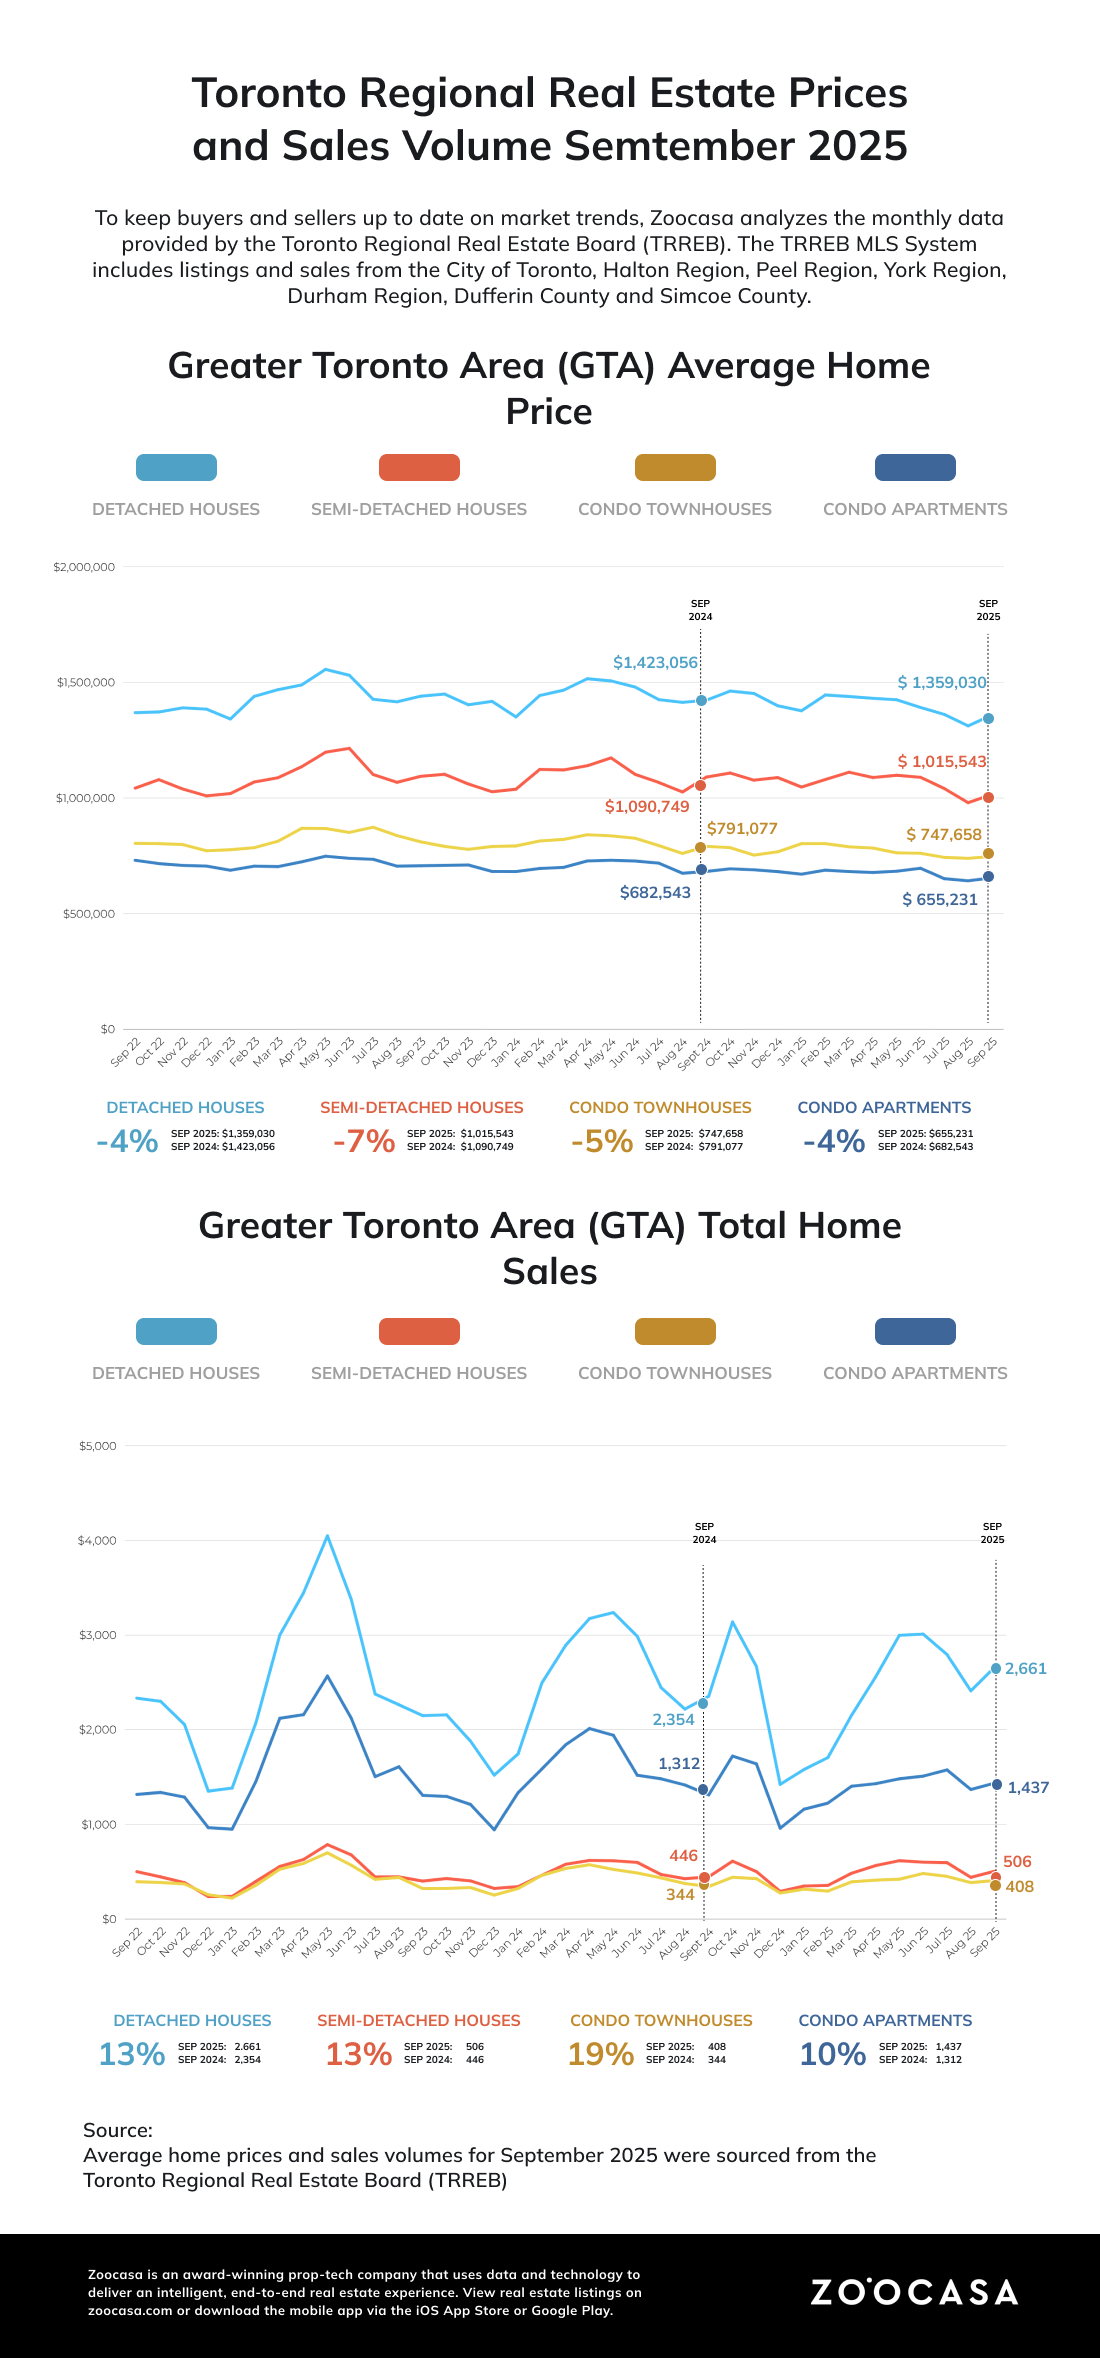
Detached homes remained the cornerstone of the GTA housing market in September 2025, with sales up 12.5% in Toronto and 8.6% in the 905 year over year, totaling 2,661 transactions—the highest among all property types. While prices eased slightly to an average of $1,359,030 (down 0.8% in Toronto and 7.2% in the 905), strong sales activity underscores that detached properties continue to set the pace for the region’s housing market.
“While home sales have improved over the past year, they still remain below normal levels relative to the number of households in the GTA. Two more 25-basis-point interest rate cuts by the Bank of Canada would see monthly mortgage payments move more in line with homebuyers’ average incomes, further spurring home sales and related economic activity,” said TRREB Chief Market Analyst Jason Mercer.
Market Adjusts to Affordability Pressures
Despite stronger activity, prices eased across all major home types, indicating that the market is adjusting to ongoing affordability constraints and increased inventory. Detached homes recorded a 5.1% annual price decline, averaging $1,359,030, while semi-detached prices fell 6.8% year over year. Townhouse prices dipped 4.7%, and condo apartments followed closely with a 4.3% decrease, averaging $655,231.
The broad-based moderation suggests that, while sales momentum is improving, buyers remain price-sensitive, and sellers are adapting to more balanced and competitive market conditions.
“The Bank of Canada’s September interest rate cut was welcome news for homebuyers. With lower borrowing costs, more households are now able to afford monthly mortgage payments on a home that meets their needs. Increased home purchases will also stimulate the economy through housing-related spin-off spending, helping to offset the impact of ongoing trade challenges,” said TRREB President Elechia Barry-Sproule.
Here’s how listings, sales, and inventory changed month-over-month in other GTA markets.
City of Toronto: Balanced Market
- New Listings: 7,182 (+58.3% m-o-m)
- Sales: 2,063 (+16.0% m-o-m)
- Active Listings: 10,653 (+10.5% m-o-m)
- Months of Inventory: 4.7 (0% m-o-m)
Peel Region: Balanced Market
- New Listings: 3,574 (+20.4% m-o-m)
- Sales: 996 (+8.9% m-o-m)
- Active Listings: 5,691 (+3.5% m-o-m)
- Months of Inventory: 5.1 (+2.0% m-o-m)
York Region: Balanced Market
- New Listings: 3,515 (+34.6% m-o-m)
- Sales: 1,032 (+3.8% m-o-m)
- Active Listings: 5,676 (+5.5% m-o-m)
- Months of Inventory: 4.9 (0% m-o-m)
Halton Region: Balanced Market
- New Listings: 2,098 (+31.7% m-o-m)
- Sales: 585 (-8.6% m-o-m)
- Active Listings: 3,130 (+7.8% m-o-m)
- Months of Inventory: 4.2 (+2.4% m-o-m)
Durham Region: Seller’s Market
- New Listings: 2,082 (+24.3% m-o-m)
- Sales: 707 (+4.6% m-o-m)
- Active Listings: 2,810 (+4.3% m-o-m)
- Months of Inventory: 3.1 (0% m-o-m)
Thinking of buying or selling in 2025? Zoocasa can help you find properties that fit your lifestyle and your budget. Start your search today.