Greater Toronto Area (GTA) home sales showed no signs of slowing down with another record-breaking month this October. The latest data from the Toronto Regional Real Estate Board (TRREB) highlights that home sales increased 25% on a year-over-year (y-o-y) basis, with 10,563 transactions taking place during the month. Annual new listings growth kept pace with home sales increases across the GTA, rising 36% with 17,802 new listings hitting the market. The average home price also hit a new record across the GTA, growing 14% y-o-y and 1% month-over-month (m-o-m) to $968,318.
Jason Mercer, TRREB’s Chief Market Analyst expects strong housing demand to persist through the rest of 2020, noting that the “economic recovery in some sectors coupled with low borrowing costs has kept home purchases top-of-mind for many GTA residents. With this being said, we have not accounted for all of the pent-up demand that resulted from the spring downturn.”
While there was upward pressure on sales, new listings, and prices across the GTA as a whole, a closer look at specific markets and market segments revealed diverging trends.
Buyers’ Market Conditions Emerge in Key Condo Apartment Markets Across the GTA
Condo buyers, according to Lisa Patel, TRREB’s President, “have benefitted from much more choice compared to last year. Pre-COVID polling had already pointed to an increase in investor selling in 2020. The pandemic only added to this trend with a stall in economic growth and a halt to tourism impacting cash flows for many investors.”
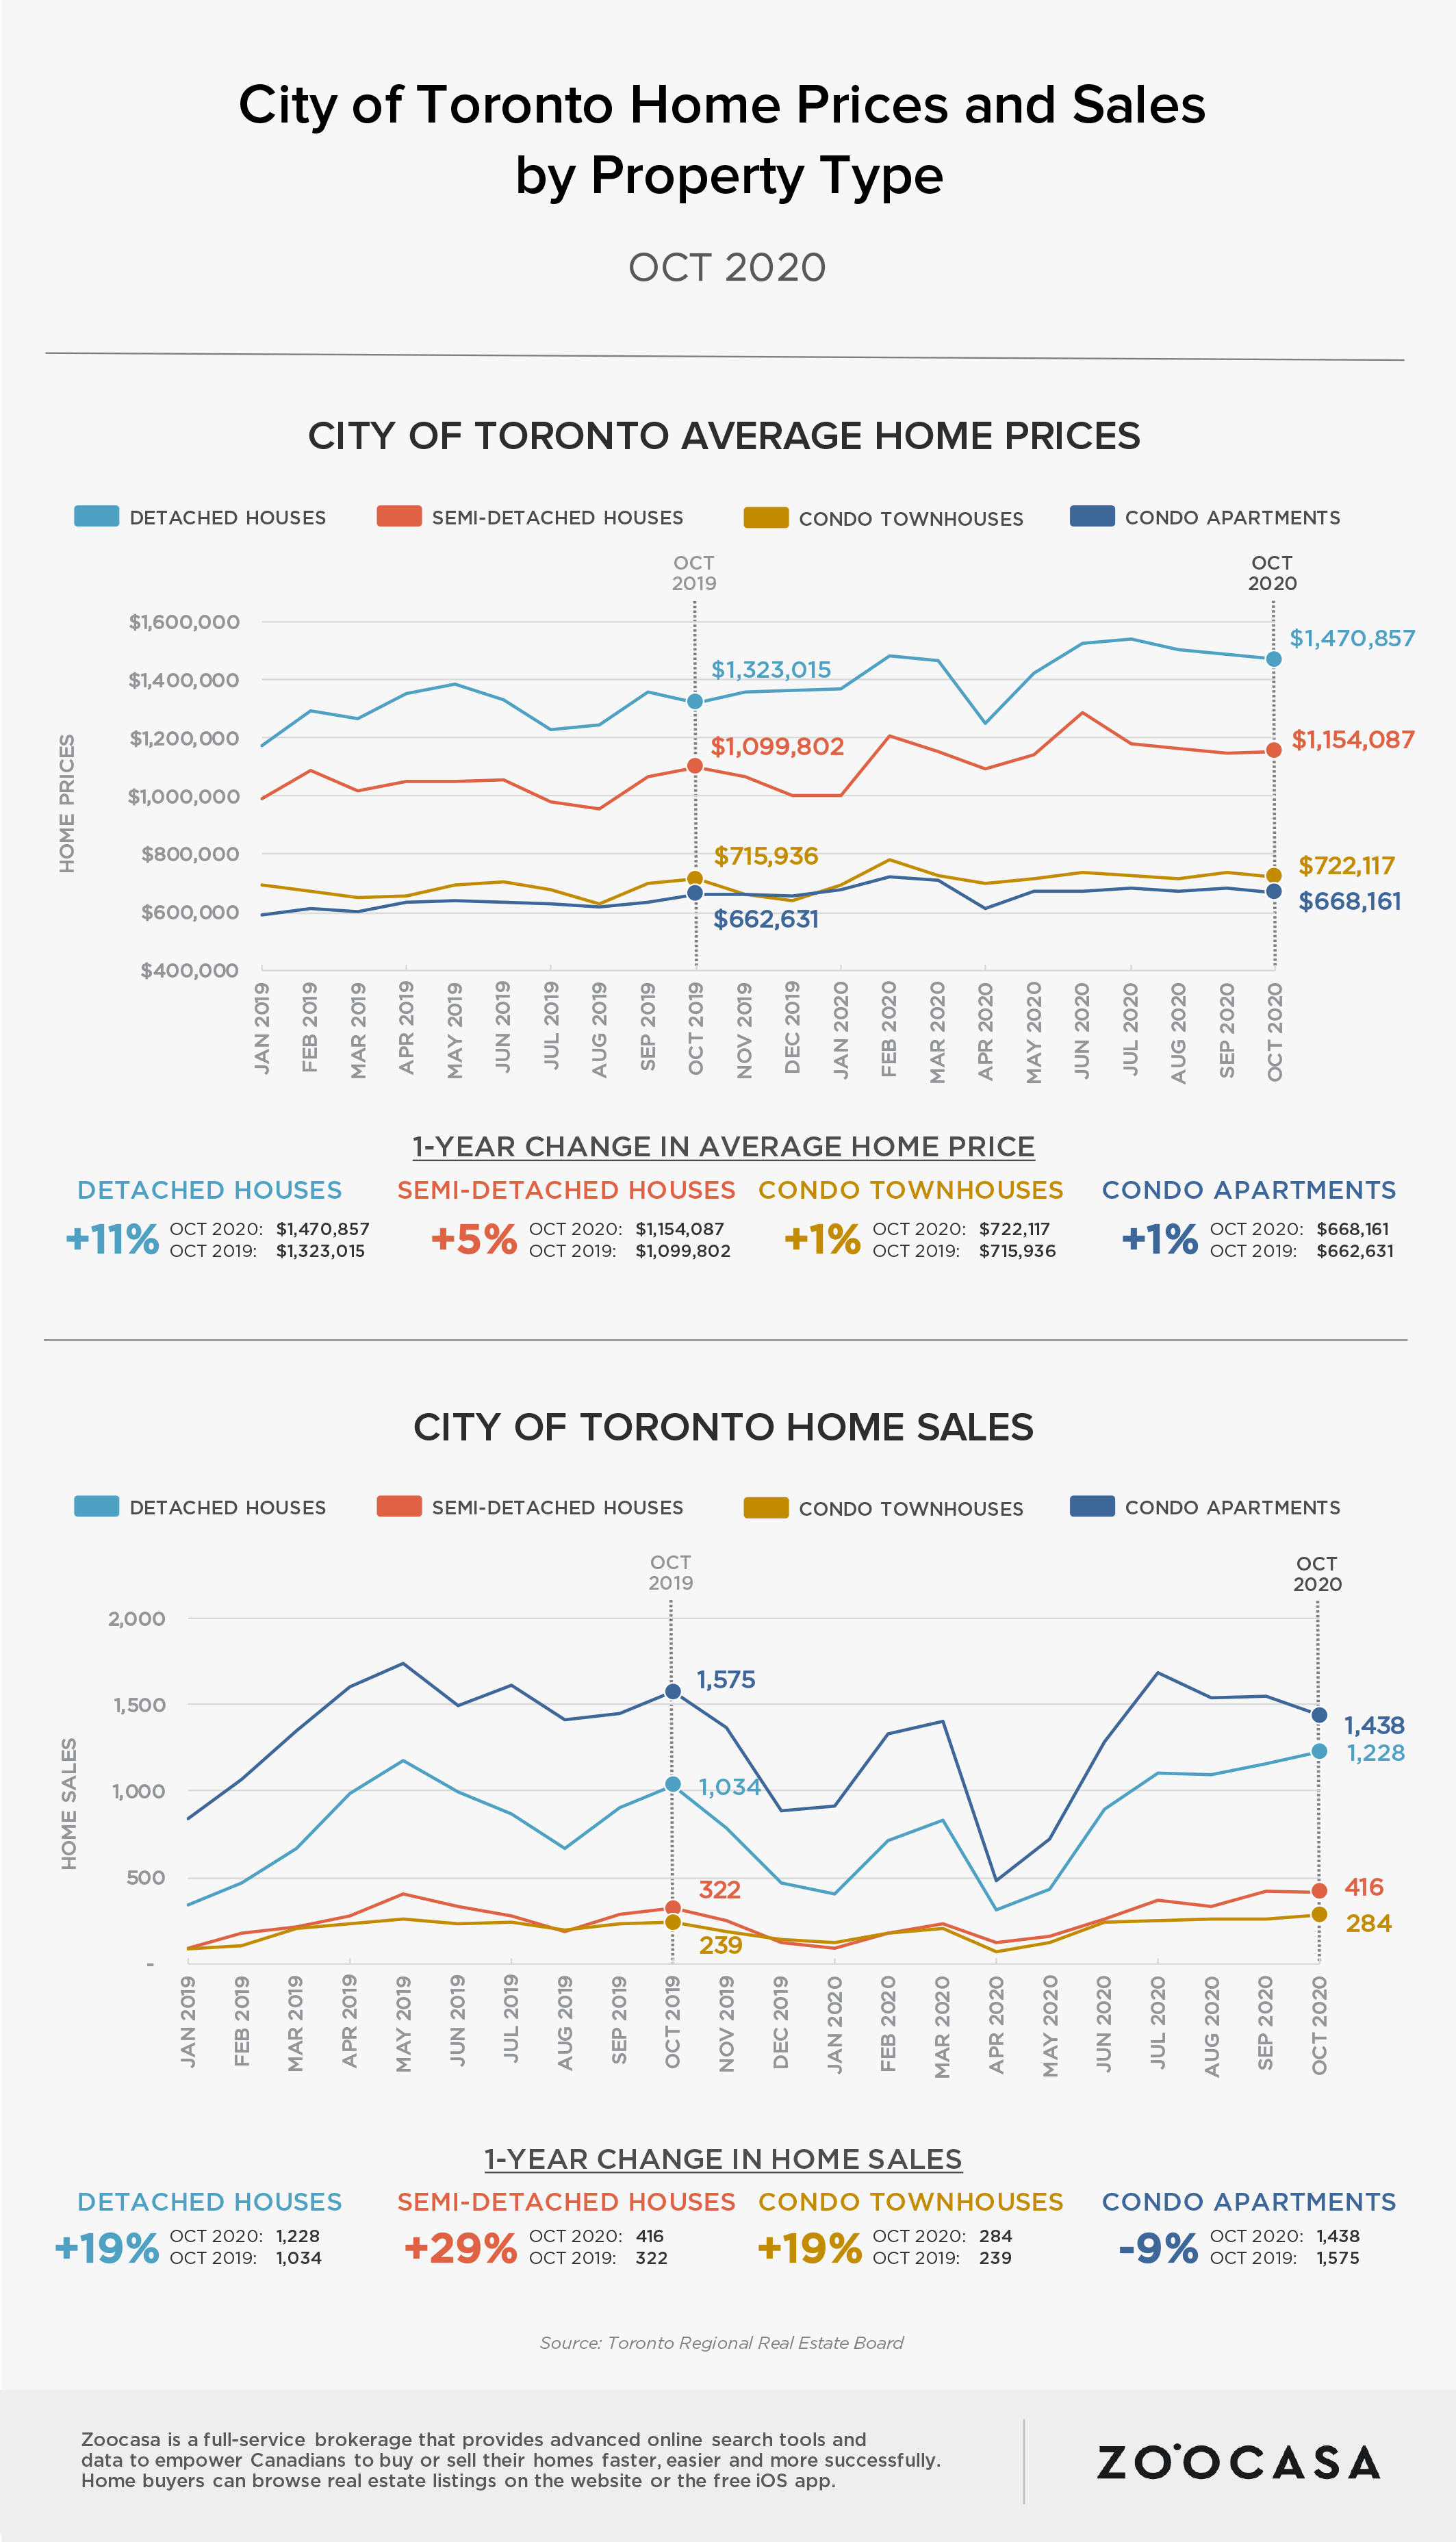
Across the Toronto Region as a whole, condo apartment sales grew a modest 2% y-o-y but there was a flood in new listings to the tune of a 103% increase y-o-y. In fact, condo-dense markets like the City of Toronto and Peel Region noted a steep divergence in sales and new listings: sales declined 9% y-o-y in the City of Toronto, but new listings increased by more than double (103%) to 6,193. In Peel Region, condo apartment sales declined 1% y-o-y, but new listings grew a whopping 118%.
As pointed out by Patel, competition for condo apartments in these regions in particular, strongly favoured buyers, with a sales-to-new-listings-ratio (SNLR) of 32% in the City of Toronto and 38% in the neighbouring Peel Region. That means there was ample supply to meet demand for condo apartments, conditions that reflect what is known as a buyers’ market. A buyers’ market exists when the SNLR is below 40%.
It bears noting that the housing competition conditions for condo apartments in October 2020 are in stark contrast to conditions at the same time last year, when the City of Toronto’s condo apartment market was in strong sellers’ market territory with an SNLR of 71% and the SNLR in Peel Region was 83%; meaning demand and supply dynamics and the resulting competition conditions strongly favoured sellers. A seller’s market exists when the SNLR is over 60%.
Elsewhere, such as in York Region, the condo apartment market maintained balanced competition conditions with an SNLR of 47%. A balanced market is one where the SNLR is between 40% and 60%. Durham Region and Halton Region remained in sellers’ market territory with an SNLR of 73% and 70% respectively, with buyers continuing to face stiff competition for available listings.
Unlike the condo apartment segment, condo townhouses remained competitive across the Toronto Region. Condo townhouse sales were up 32% y-o-y for the region as a whole, while listings tried to keep pace, with a 46% increase y-o-y. Competition conditions reflected a sellers’ market, with an SNLR of 65%. Sellers’ market conditions also persisted across all regional markets with the exception of the City of Toronto. In the City of Toronto, sales increased just 19%, but new listings grew 41%, resulting in balanced housing competition with an SNLR of 58%.
Competition Remained Strong for Single-Family Homes Across the GTA
In contrast to the condominium segment, particularly condo apartments, “competition between buyers of single-family homes, and particularly detached houses, remained strong last month and continued to support double-digit annual rates of price growth in many GTA neighborhoods,” said Patel.
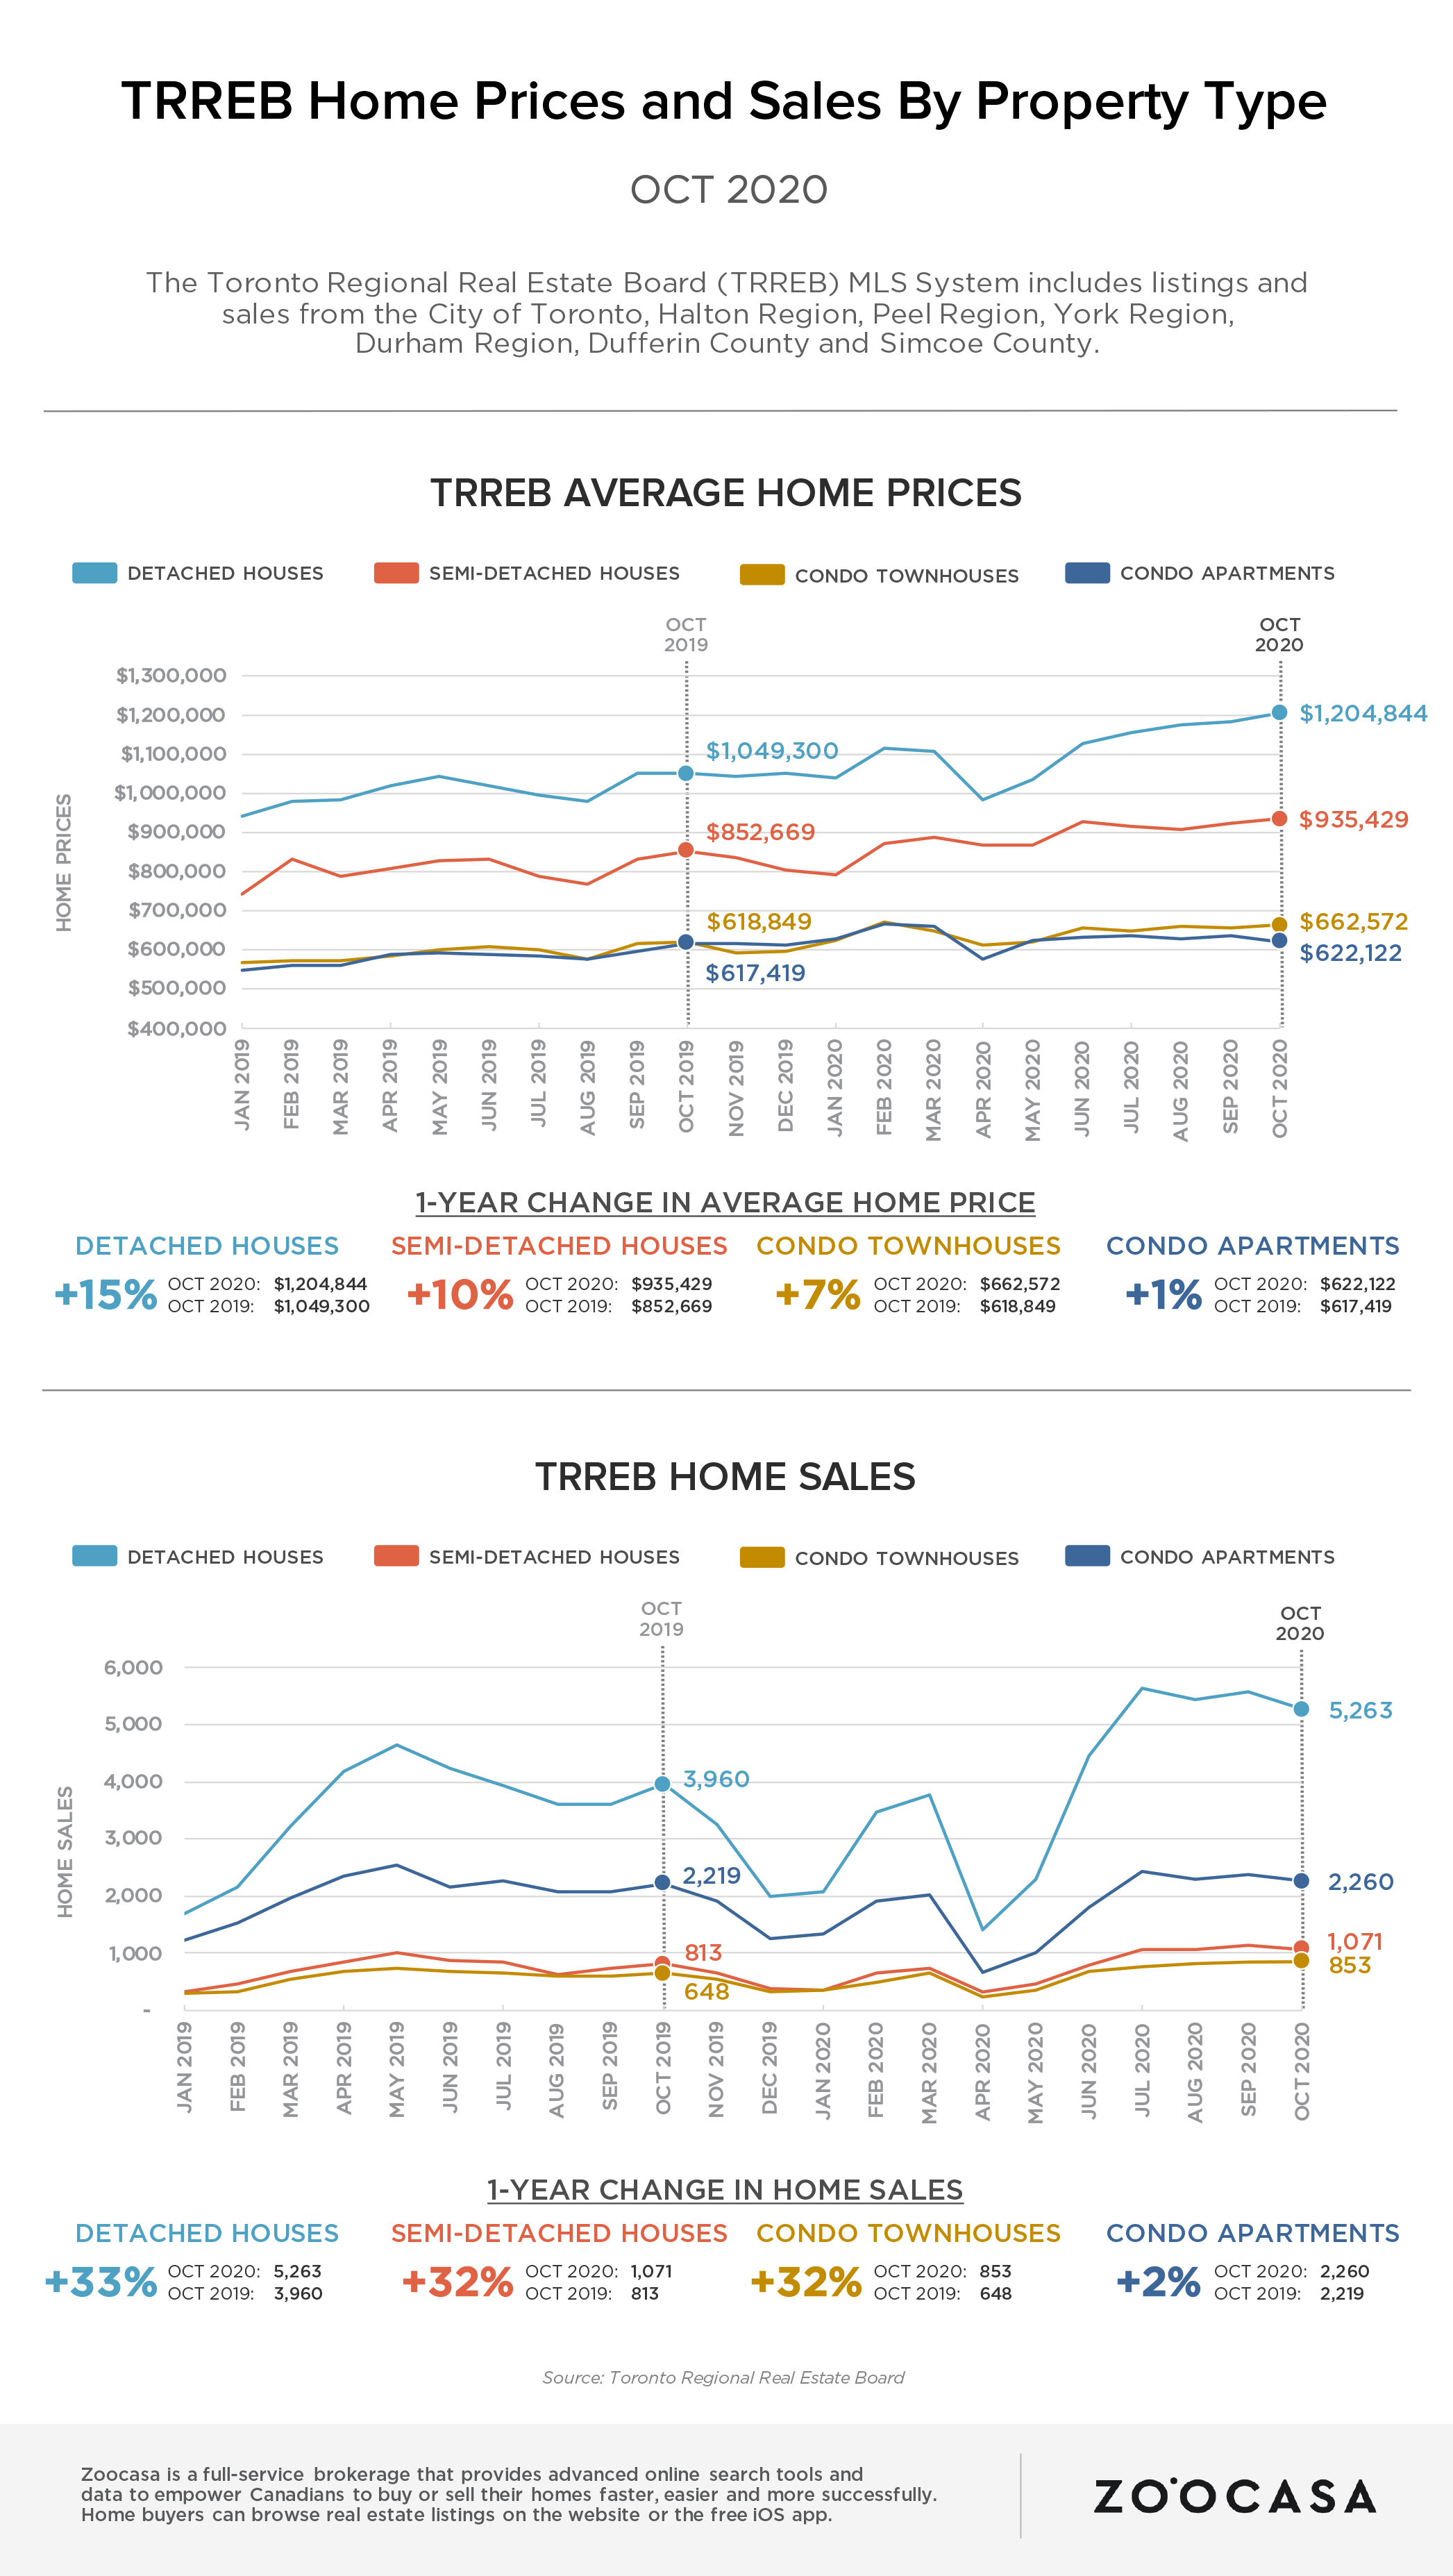
The average price for detached properties crossed the $1.2M mark in October to $1,204,844 – a 15% increase y-o-y. Durham Region and Halton Region noted the strongest pace of annual price growth, with a 23% ($821,879) and 22% ($1,336,796) increase in the average home price respectively. In the City of Toronto, the average home price for detached properties grew 11% y-o-y to $1,470,857.
Detached home sales increased 33% y-o-y across the Toronto Region, with 5,263 homes trading hands. Competition remained fierce, and strongly favoured sellers with new listings growing just 7% and the SNLR at 71%. Halton Region noted the strongest sales increases, growing a staggering 47% annually; followed by Peel Region (43% y-o-y), York Region (40% y-o-y) and Durham Region (35% y-o-y). Detached homes sales grew 19% y-o-y in the City of Toronto, with 1,228 transactions taking place in October 2020.
Following a similar trend, the average home price for semi-detached properties grew 10% y-o-y across the Toronto Region to $935,429. Durham Region, York Region, and Halton Region led annual average price growth: prices grew 20% ($617,161) in Durham Region, 19% ($930,428) in York Region, and 18% ($822,474) in Halton Region. The City of Toronto noted some of the slowest growth in annual prices, with the average price for semi-detached properties rising 5% y-o-y to $1,154,087.
There was strong competition for semi-detached properties in the Toronto Region, with an SNLR of 77%. This was driven by a 32% annual increase in home sales and a 38% increase in new listings. Durham Region set the pace for semi-detached home sales across the Toronto Region. There, sales grew a remarkable 65% y-o-y, while new listings comparatively struggled to keep up, resulting in an SNLR of 94%. This was followed by York Region, where the SNLR was 88%, and sales grew 40% y-o-y, while listings increased 47%.
In the City of Toronto, competition conditions still favoured sellers, with semi-detached home sales increased 29% while new listings grew 38% annually, resulting in an SNLR of 68%.
Check out the infographics below to see how sales and average prices changed by home type for TRREB and the City of Toronto in October.
Note: Comments and stats highlighting the Toronto Region as a whole are a reference to the areas covered by TRREB, which include: Durham Region, Halton Region, Peel Region, York Region, Toronto, Dufferin County and Simcoe County.
For more information about this report or to set up a media interview, please contact [email protected]