If you’ve been waiting for the right time to buy a home in Toronto, there’s no greater time than the present. According to the January TRREB report, the average home price in the GTA has fallen below $1M for the first time in five years, to $973,289. “Buyers will benefit from substantial choice in 2026, which will keep a lid on price growth and affordability in check, particularly in the first half of the year,” said TRREB’s Chief Information Officer Jason Mercer.
A total of 3,082 home sales were recorded in January 2026, down 19.3 per cent year over year, and new listings were also down 13.3 per cent year over year.
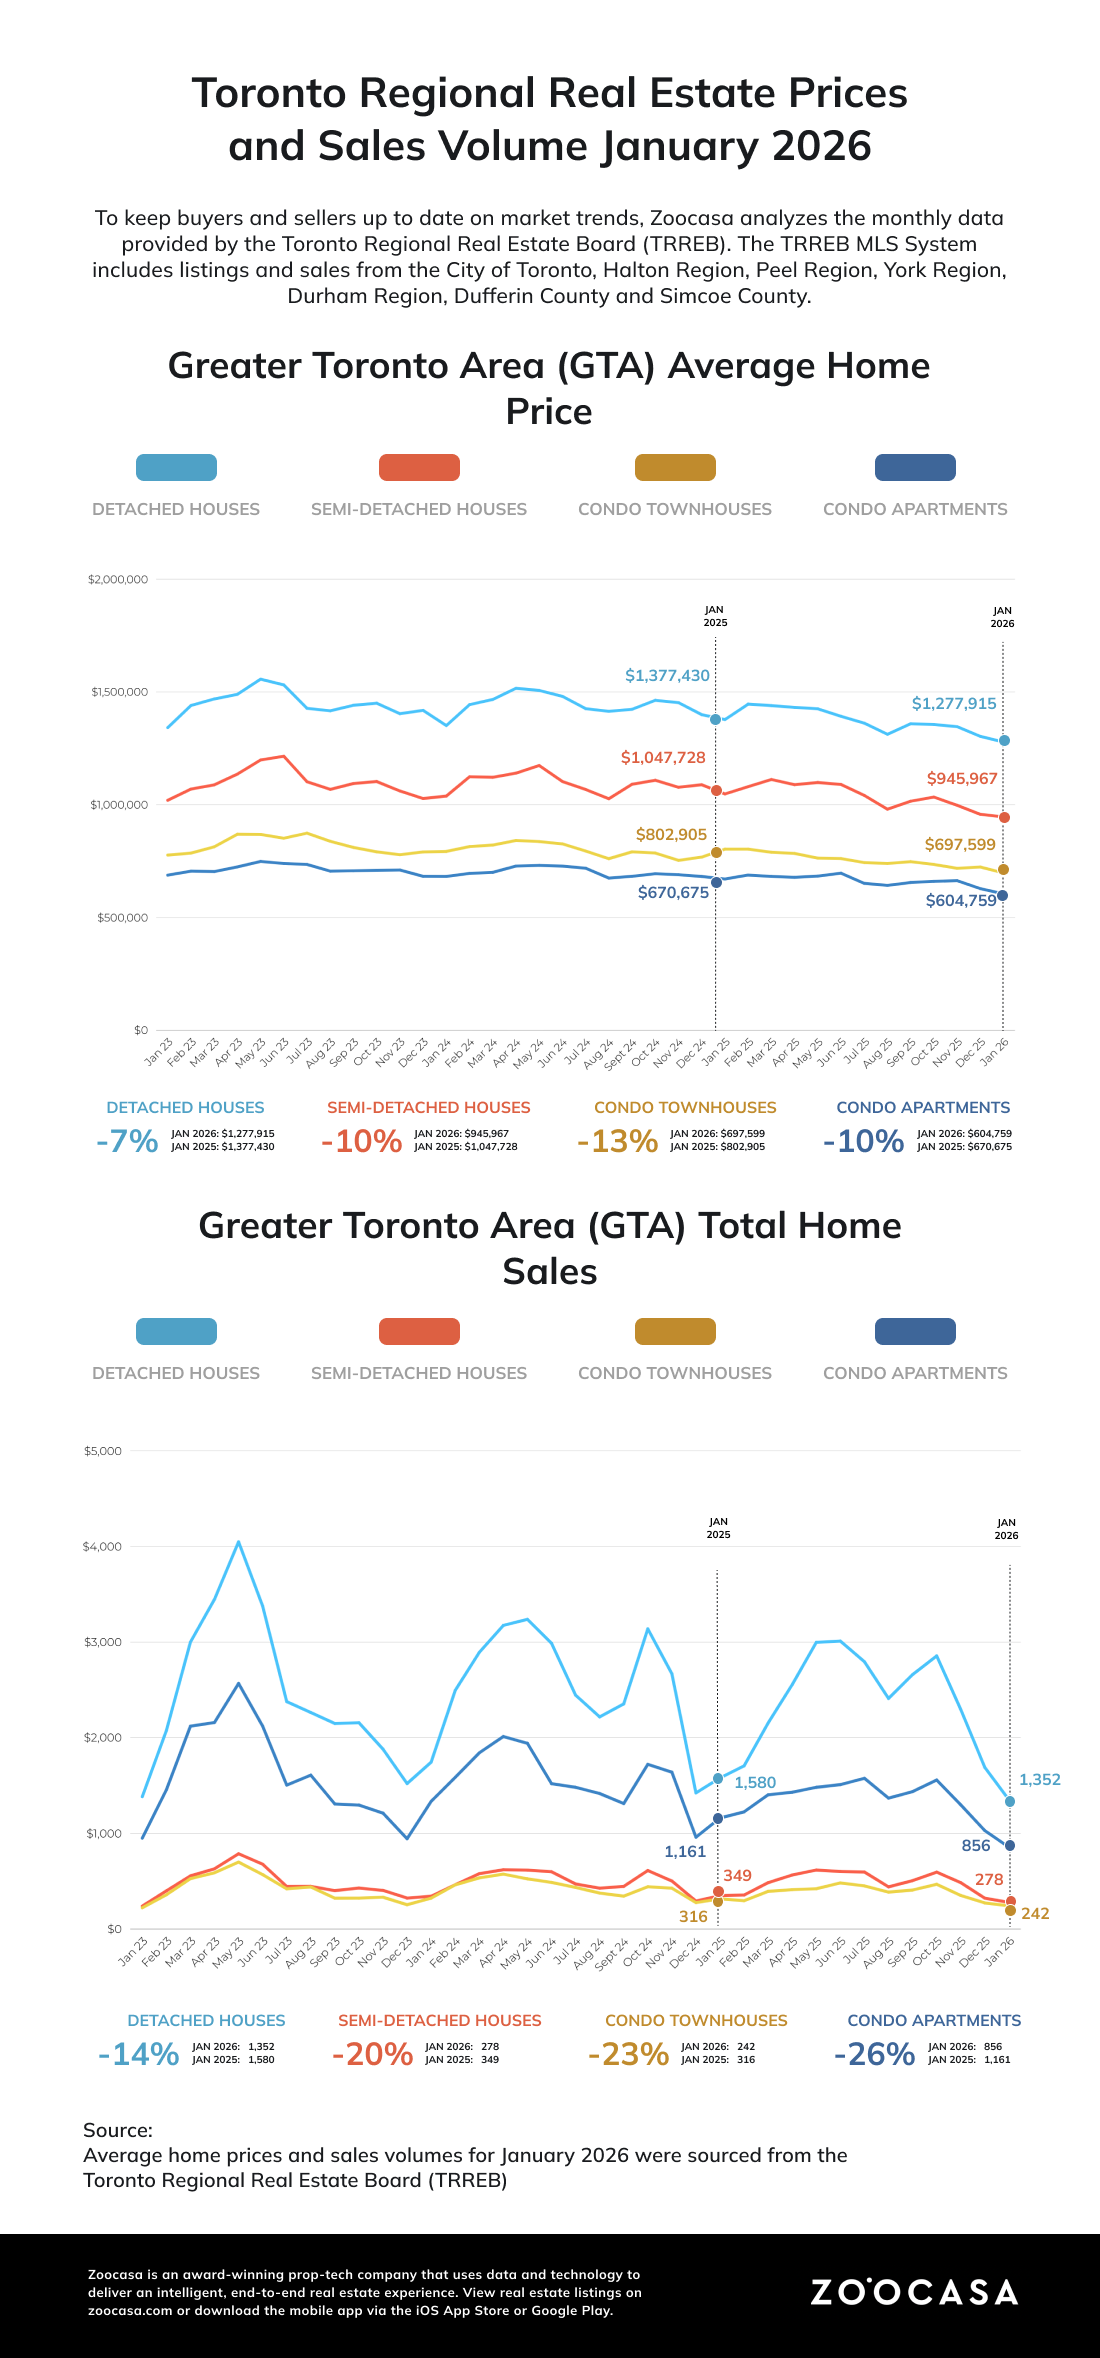
The Greater Toronto Area real estate market is seeing a sharp drop in activity and a growing price gap between the city and the suburbs. Condos in the 905, now priced at an average of $551,166, have been hit hardest, with sales falling by 30.3% year-over-year, the biggest drop of any segment. This has pulled the overall GTA condo market down by 26.0%.
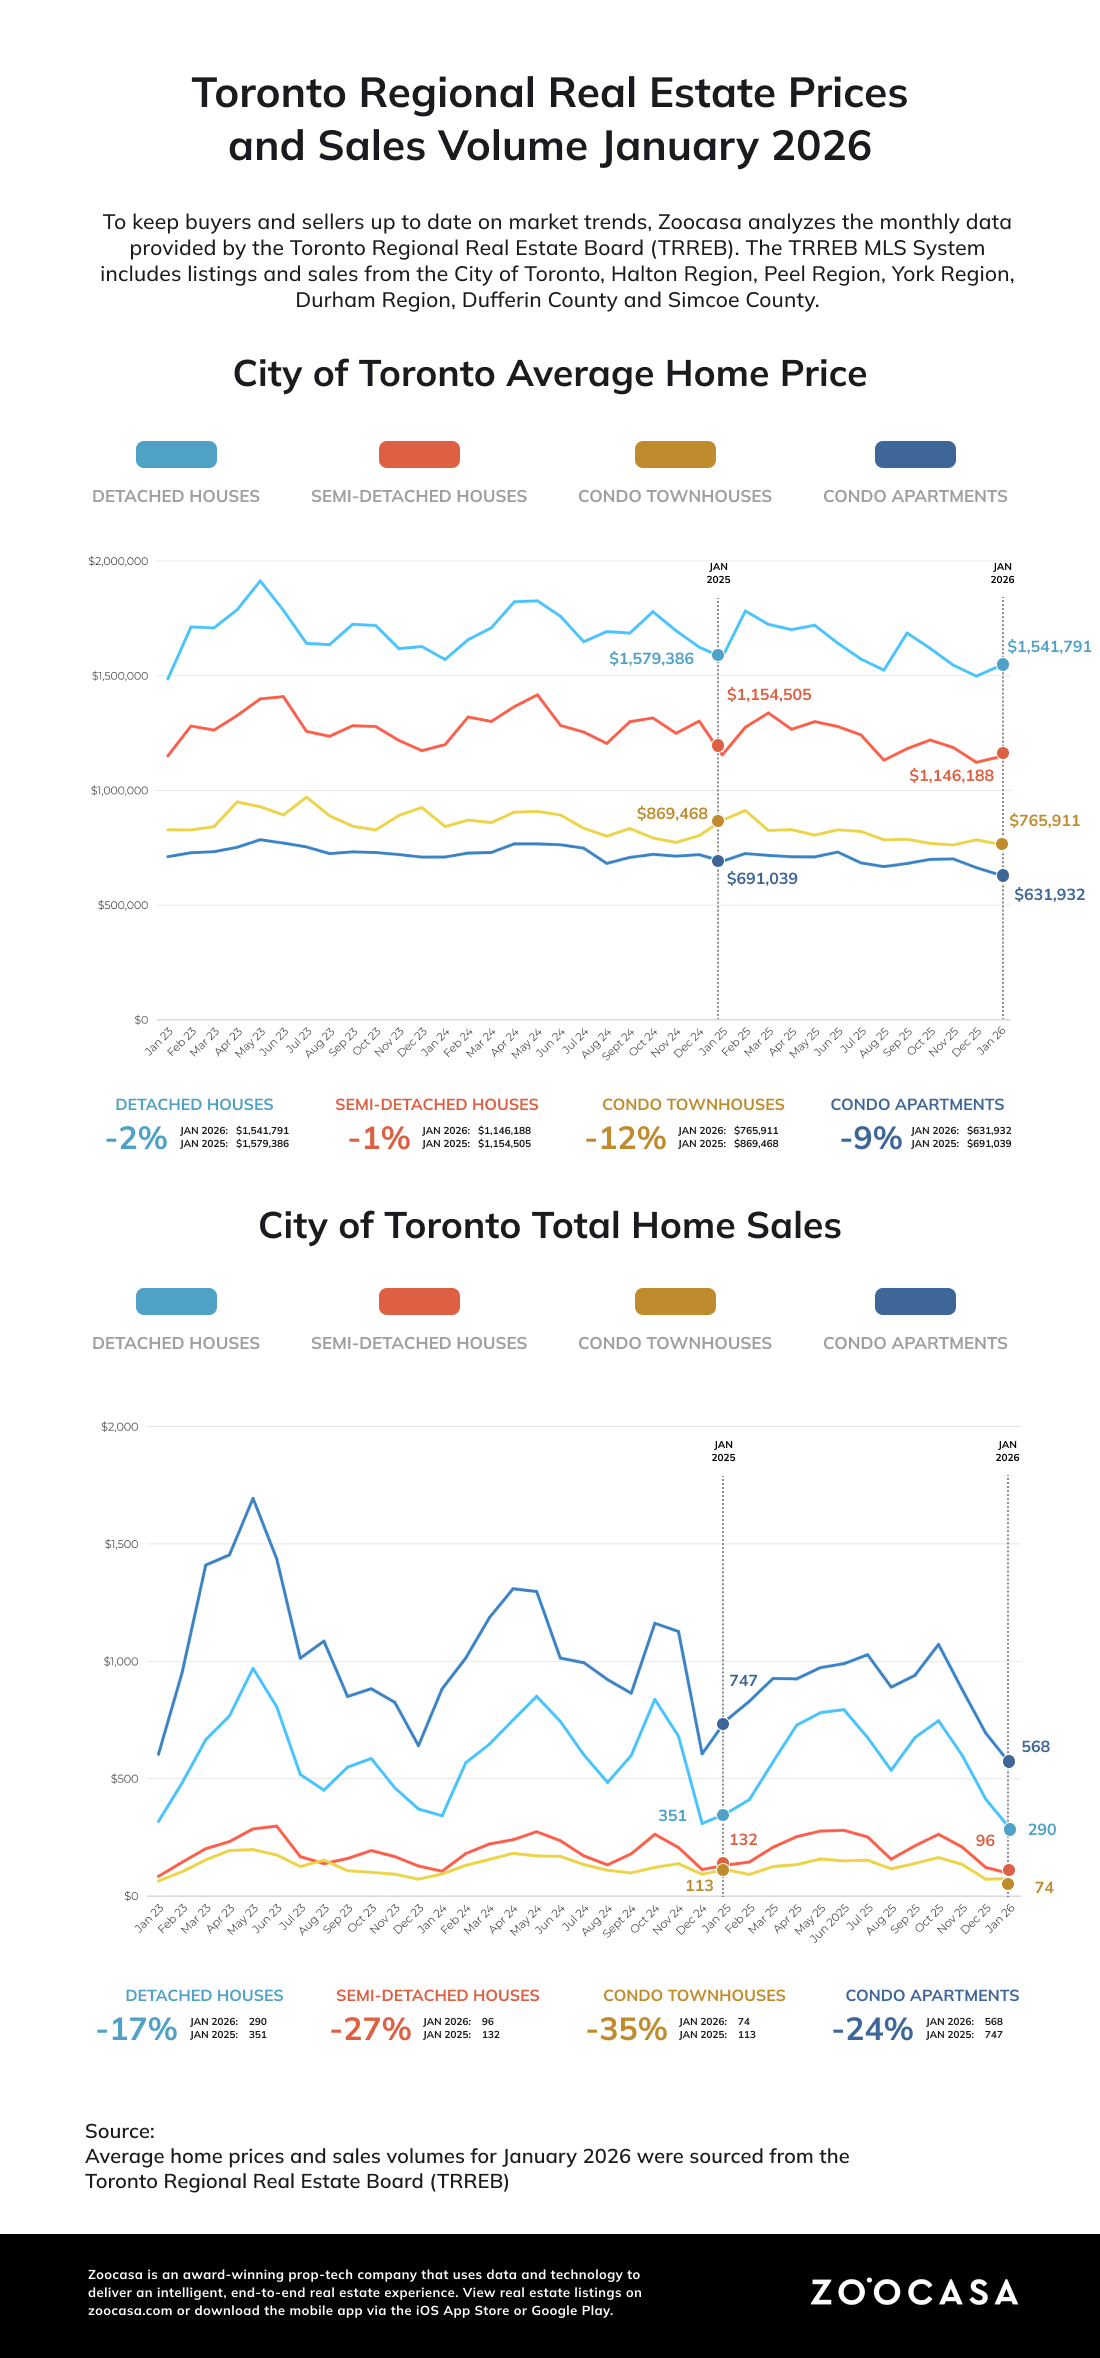
Sales have dropped by double digits in every housing category, but there is a clear difference in how prices are holding up. Home prices in the 416 area have remained fairly stable, while prices in the 905 area are experiencing larger declines. This is especially true for semi-detached homes, where suburban prices fell by 14.5% annually to $840,356, compared to just a 0.9% dip in the city, where prices were $1,146,188. The Toronto market is continuing its slowdown, as 416 condo prices dropped 8.6% year over year to $631,932.
TRREB Region Sees Fewer Than 1,000 Condo Sales
The condominium market recorded just 856 total sales, with activity heavily concentrated in the City of Toronto ($631,932), which maintained a majority of the market share (66%) with 568 transactions. While the Peel Region ($530,195) and York Region ($618,000) rounded out the top three for sales volume, the Halton Region ($629,896) emerged as the most significant high-value competitor to Toronto, nearly matching its average price despite a lower sales count. Within Halton, the market was highly localized, as Oakville ($625,321) accounted for half of the region’s total condo sales. Overall, both Toronto and Halton notably outpaced the broader TRREB average of $604,759, while the Peel and York regions offered more affordable entry points for buyers in the GTA’s primary metropolitan hubs.
Detached Homes Remain in Demand, Most Condo Buyers Looking for Steals
Most buyers in the Toronto area remain interested in detached homes, accounting for 43.9% of the market and 1,352 units sold. In the most expensive category, the average price is $1.2 million, with sales primarily driven by the $1M to $1.5M range, which accounts for over 550 transactions.
On the other hand, nearly a third (27.8%) of all buyers purchased a condo. While the average price sits at $604,759, the majority of sales are actually lower; most buyers are purchasing in the $400,000 to $599,999 range, which saw nearly 500 sales in all of January.
All Property Types Saw Price Drops, Listings Outpace Sales
Looking back at 2025, no segment in the housing market was immune to price declines. Detached homes saw the largest correction, with the average price falling to $1,379,666 (a 5.2% decline). Semi-detached and townhomes followed suit, settling at average prices of $1,050,605 and $876,354, respectively. The condo market is under the most intense pressure, recording the largest drop in sales volume at 14.7%, with only 16,425 units sold. Despite having the lowest entry point at an average of $667,235, the segment’s 5.1% price slide and high volume of 56,263 new listings within the year (a 3.3% increase) suggest a period of stagnation as buyers remain cautious.
The 2025 Toronto market was defined by a massive gap between expectations and reality. While 84,614 detached homes were listed, only 28,545 actually sold—a dismal 33.7% sales-to-new-listings ratio that firmly planted this sector in a buyer’s market. The condo sector was even more saturated; with 56,263 new listings and just 16,425 sales, the ratio dropped to 29.2%, meaning for every condo that sold, more than three new ones were added to the inventory pile. Townhomes and semi-detached properties didn’t escape the trend either, posting ratios of 35.3% and 44.5%, respectively. Because new listings grew by as much as 17.3% while sales volume plummeted by double digits (down 14.7% in condos alone), the market became flooded. This oversupply triggered a universal price correction, as sellers competed for a shrinking pool of buyers who suddenly had more options than they had seen in years.
2026 Buyer Snapshot
Looking ahead to 2026, the Toronto Regional Real Estate Board (TRREB) expects between 60,000 and 70,000 homes to sell this year, with an average price tag of $1 million to $1.03 million. While nearly half of potential buyers (45%) are looking to buy their first home, money remains tight. Most people are finding that their description of the “ideal home” costs about $600 more per month than they can actually afford to pay for a mortgage.
City of Toronto
- New Listings: 4,077 (+109.1% m-o-m)
- Sales: 1,074 (-21.2% m-o-m)
- Active Listings: 6,968 (+7.9% m-o-m)
- Months of Inventory: 5.0 (+2.0% m-o-m)
Peel Region: Balanced Market
- New Listings: 2,067 (+78.0% m-o-m)
- Sales: 609 (-8.6% m-o-m)
- Active Listings: 3,456 (+3.4% m-o-m)
- Months of Inventory: 5.5 (+1.9% m-o-m)
York Region: Seller’s Market
- New Listings: 1,996 (+103.5% m-o-m)
- Sales: 554 (-18.9% m-o-m)
- Active Listings: 3,458 (+3.3% m-o-m)
- Months of Inventory: 5.5 (+1.9% m-o-m)
Halton Region: Seller’s Market
- New Listings: 1,121 (+151.3% m-o-m)
- Sales: 326 (-14.2% m-o-m)
- Active Listings: 1,775 (+9.5% m-o-m)
- Months of Inventory: 4.6 (+2.2% m-o-m)
Durham Region: Seller’s Market
- New Listings: 1,084 (+104.9% m-o-m)
- Sales: 412 (-9.5% m-o-m)
- Active Listings: 1,449 (+1.8% m-o-m)
- Months of Inventory: 3.4 (0% m-o-m)