
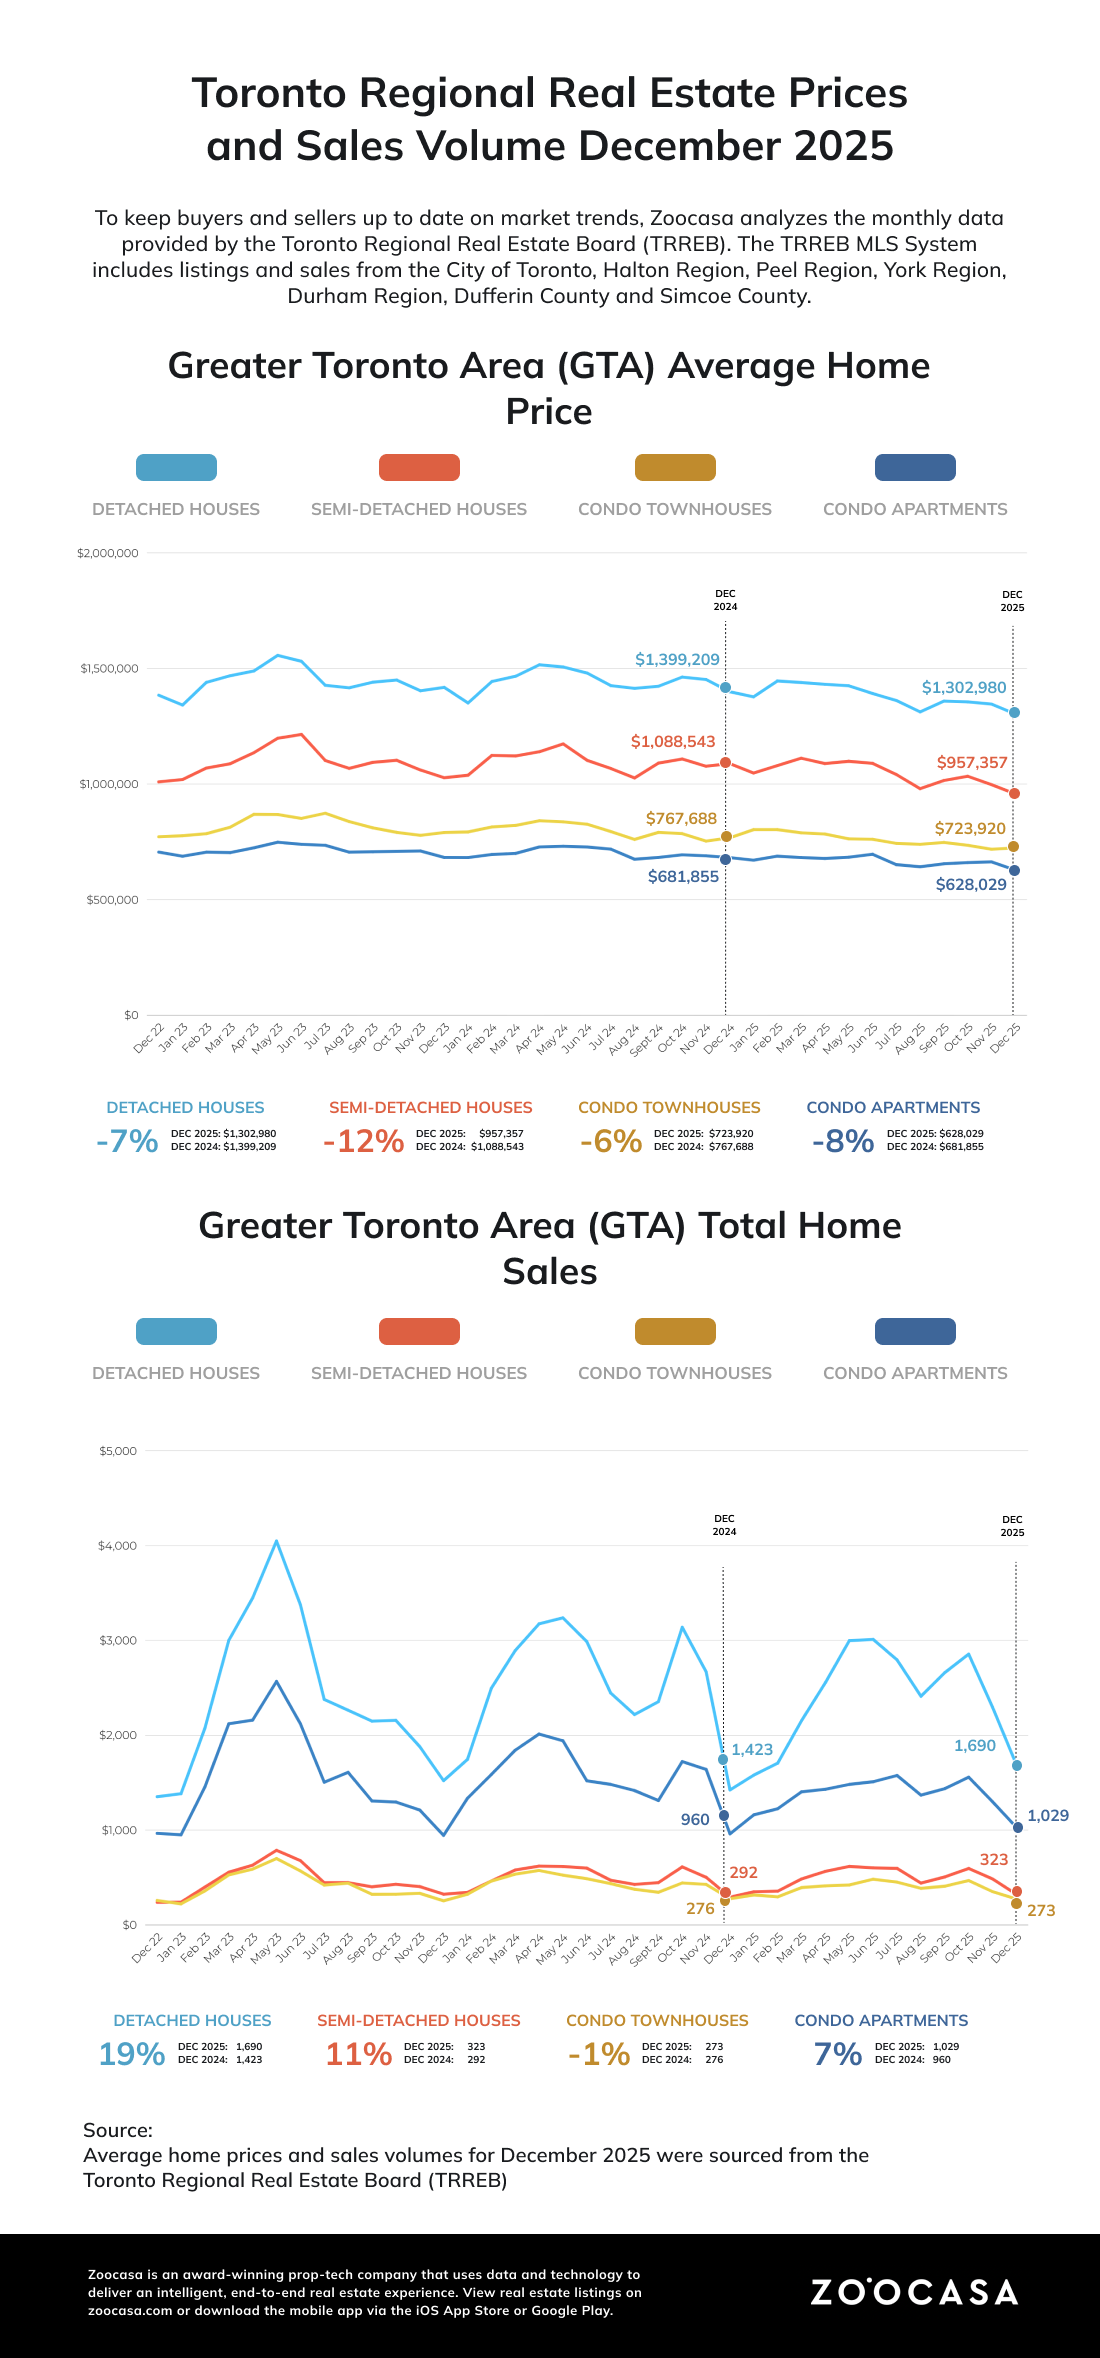
In December 2025, pricing pressure continued as the market responded to affordability constraints. Semi-detached homes experienced the largest year-over-year decline, falling 11.4% to an average of $957,357.
Detached properties decreased 5.9% to $1,302,980, while condos dropped 7.3% to $628,029. Townhouses declined 6.0% overall, despite a rare increase in 416 prices, averaging $862,024. These price drops indicate that sellers are adjusting expectations to attract price-conscious buyers, increasing market accessibility.
Buyers Opt for Detached Homes Over Condos
Detached homes led buyer activity, representing nearly 46% of all sales (1,690 transactions) at an average price of $1,302,980 across all TRREB regions. Most detached sales occurred in the $1M to $1.25M range, while the luxury segment remained strong, with over 200 detached properties selling above $2M.
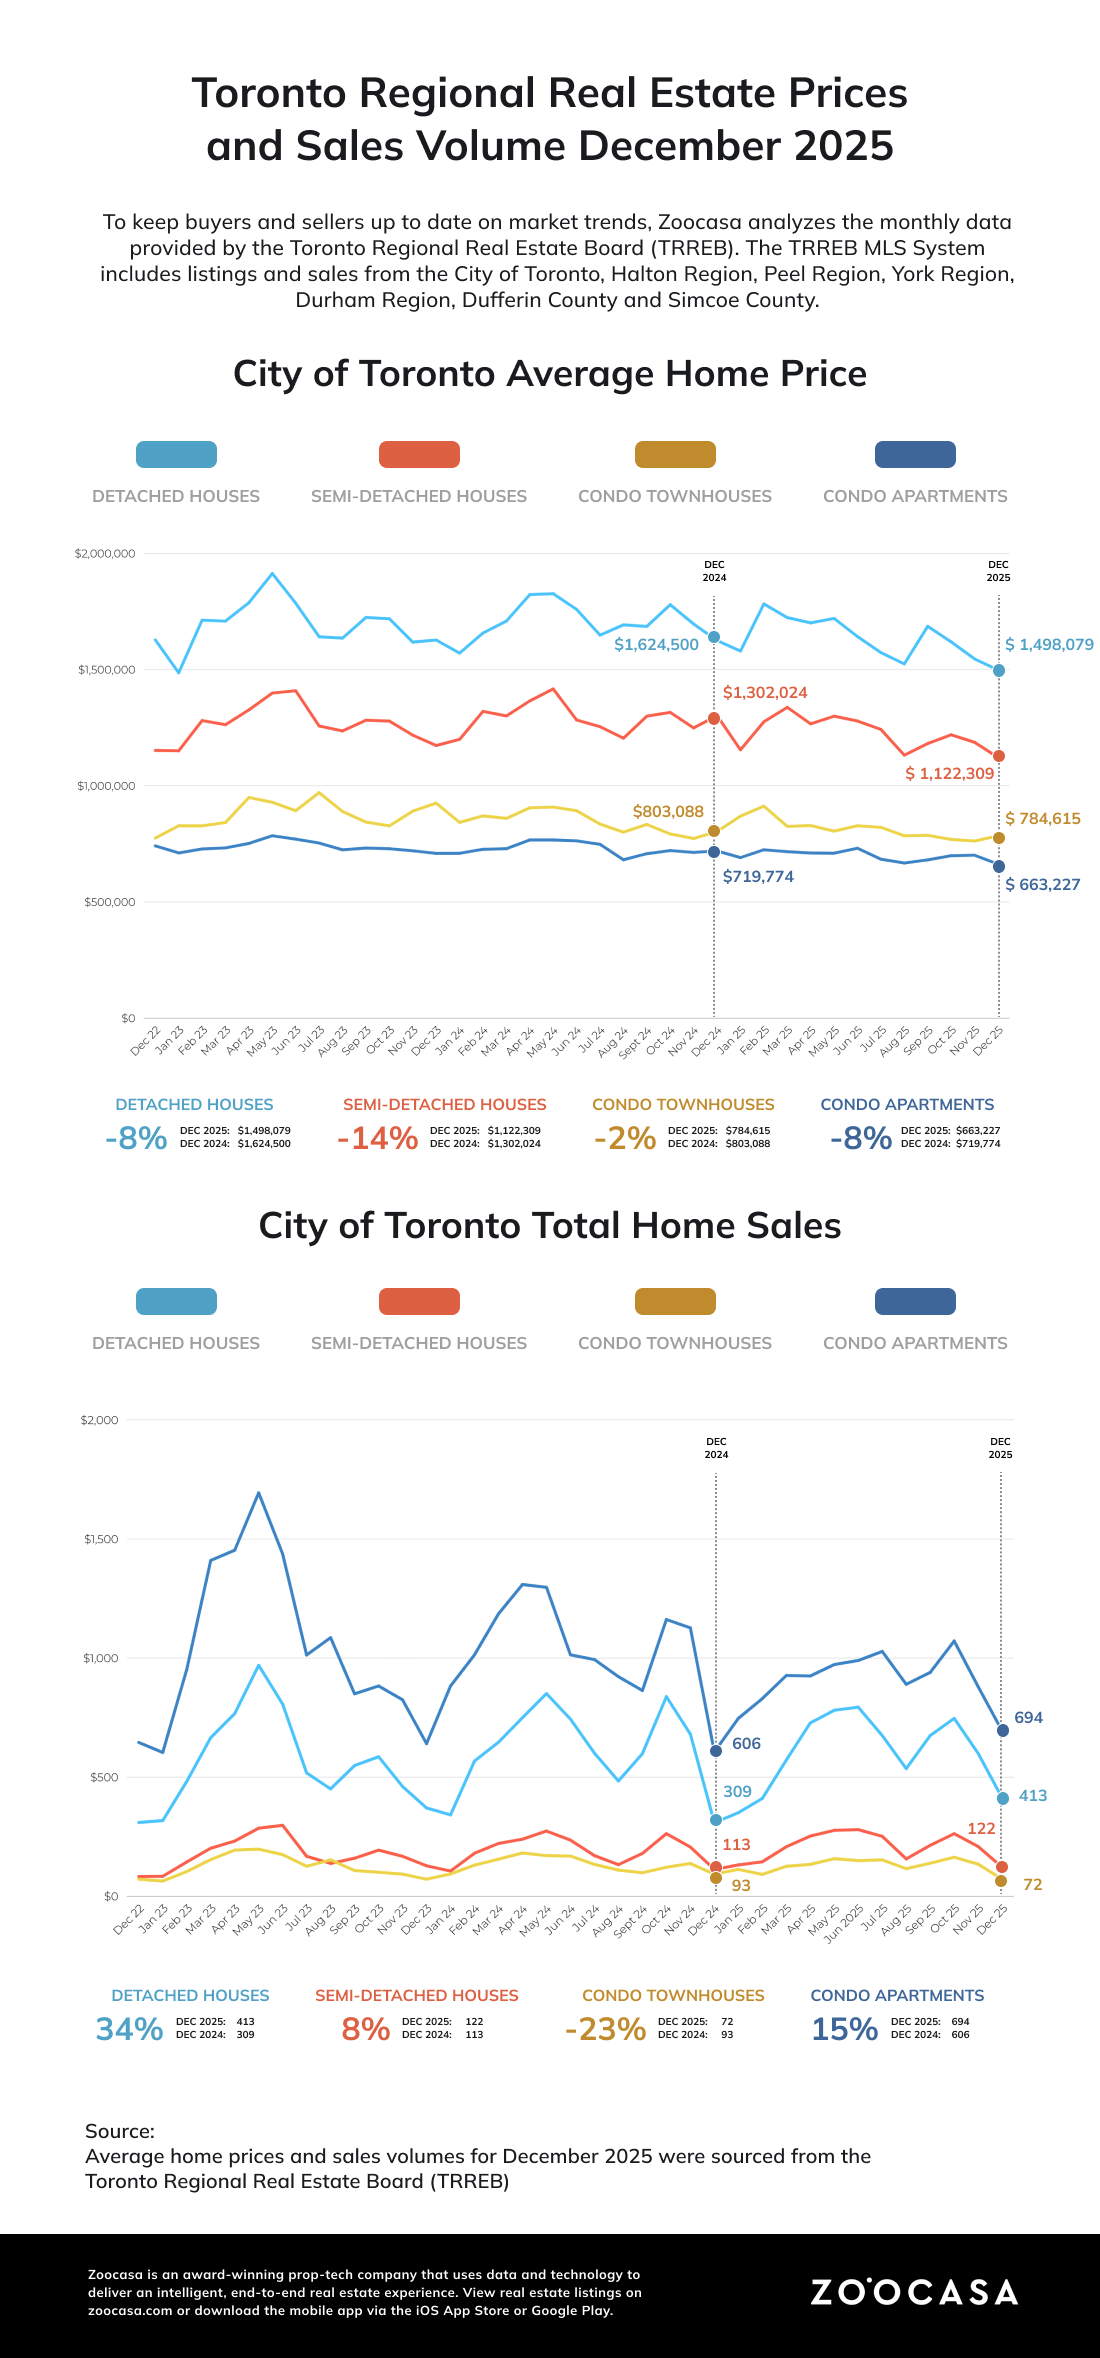
Across all TRREB regions, the condo apartment segment accounted for 27.8% of market share, with 1,029 sales and an average price of $628,029. In the city of Toronto, there were 3,927 active listings, of which 1,193 were new in December. Out of that inventory, 694 sold.
Meanwhile, semi-detached and attached/row townhouses traded closely in price throughout all TRREB areas, averaging $957,357 and $972,915, respectively, while condo townhouses offered a more affordable alternative at $723,920.
Inventory Continues to Pile Up at Year’s End
Sales activity continued to slow in December. Across the TRREB region, 3,697 homes were sold, representing an 8.9% decrease from the 4,056 reported in 2024.
Despite slower sales, inventory levels increased. New listings rose 1.8% year-over-year to 5,299. Active listings grew more significantly, up 17.5% from 14,476 in December 2024 to 17,005 in December 2025. This increase suggests that while buyer activity declined, sellers continued to list properties, resulting in greater market choice.
Pricing and Market Pace Adjusted Accordingly
The shift in the supply-and-demand balance exerted downward pressure on prices. The average selling price settled at $1,006,735, a 5.1% decline y-o-y.
The market also slowed, with homes taking longer to sell. The average Listing Days on Market (LDOM) increased to 41 days from 36, while Property Days on Market (PDOM) rose to 65 days from 55. These figures indicate that buyers are taking more time to make decisions and have greater leverage in the current market.
“The GTA housing market became more affordable in 2025 as selling prices and mortgage rates trended lower. Improved affordability has set the market up for recovery. Once households are convinced that the economy and labour market are on a solid footing, sales will increase as pent-up demand is satisfied,” said TRREB President. Daniel Steinfeld.
The Sub-$900k “Sweet Spot”
This month’s report shows that affordability is the primary driver in the GTA market, with the market’s “sweet spot” well below $900,000. While luxury areas retain their value, the highest sales efficiency and tightest inventory are found in more accessible price ranges.
Toronto East is outperforming other city areas in price retention. With an average price of $887,355, significantly lower than Toronto Central’s $1.08 M, Toronto East recorded 318 sales.
Durham Region continues to drive affordability with an average price of $844,473. Oshawa stands out as a prime example of this, with an accessible average price of $729,243.
Demand for affordability has resulted in rapid turnover in select suburban areas. Ajax, Clarington, and Whitby currently have the tightest markets in the GTA, each with approximately 3.0 months or less of inventory, well below the TRREB average of 4.9 months.
In the City of Toronto, there is a notable gap between sales volume and median price. While Toronto leads in total sales volume, the median price is relatively low at $780,000, likely due to a high condo inventory and lower list prices. Toronto’s median price trails Peel Region ($850,000) and Halton Region ($970,000), indicating that a large number of lower-priced condo sales is driving down the city’s median price.
Conversely, affluent suburbs are seeing price peaks that dwarf the City’s average of $986,542. Notably, Oakville ($1.34 million) and Stouffville ($1.58 million) maintain significantly higher average price points.
For buyers seeking the lowest entry prices, the most affordable options are in the north and east. Simcoe County and certain areas of Durham represent the most affordable deals. Innisfil recorded an average sale price of $700,158, while Brock had the lowest average at $616,150, based on 10 sales.
Here’s how listings, sales, and inventory changed month-over-month in other GTA markets.
City of Toronto: Seller’s Market
- New Listings: 1,950 (-53.3% m-o-m)
- Sales: 1,363 (-28.7% m-o-m)
- Active Listings: 6,456 (-31.1% m-o-m)
- Months of Inventory: 4.9 (0.0% m-o-m)
Peel Region: Balanced market
- New Listings: 1,161 (-46.6% m-o-m)
- Sales: 666 (-20.8% m-o-m)
- Active Listings: 3,341 (-27.9% m-o-m)
- Months of Inventory: 5.4 (+1.9% m-o-m)
York Region: Seller’s Market
- New Listings: 981 (-53.7% m-o-m)
- Sales: 683 (-23.5% m-o-m)
- Active Listings: 3,346 (-30.5% m-o-m)
- Months of Inventory: 5.4 (+3.8% m-o-m)
Halton Region: Seller’s Market
- New Listings: 446 (-57.4% m-o-m)
- Sales: 380 (-30.3% m-o-m)
- Active Listings: 1,621 (-33.4% m-o-m)
- Months of Inventory: 4.5 (+2.3% m-o-m)
Durham Region: Seller’s Market
- New Listings: 529 (-55.4% m-o-m)
- Sales: 455 (-26.9% m-o-m)
- Active Listings: 1,424 (-33.9% m-o-m)
- Months of Inventory: 3.4 (+3.0% m-o-m)
Planning your next move for 2026? Zoocasa can help you find properties that fit your lifestyle and your budget. Start your search today.