Zoocasa
Sold Prices
Map
Market Insights
  • Blog Home
  • For Buyers
  • For Sellers
  • Real Estate News
  • Mortgage News in Canada
  • Free Guides (PDF)
  • Real Estate Infographics
Zoocasa
  • Blog Home
  • For Buyers
  • For Sellers
  • Real Estate News
  • Mortgage News in Canada
  • Free Guides (PDF)
  • Real Estate Infographics
Home Real Estate News

November Toronto Home Sales and Prices See Greatest 2019 Growth: TREB

Penelope Graham by Penelope Graham
December 4, 2019
in Real Estate News, Toronto Real Estate
Reading Time: 3 mins read
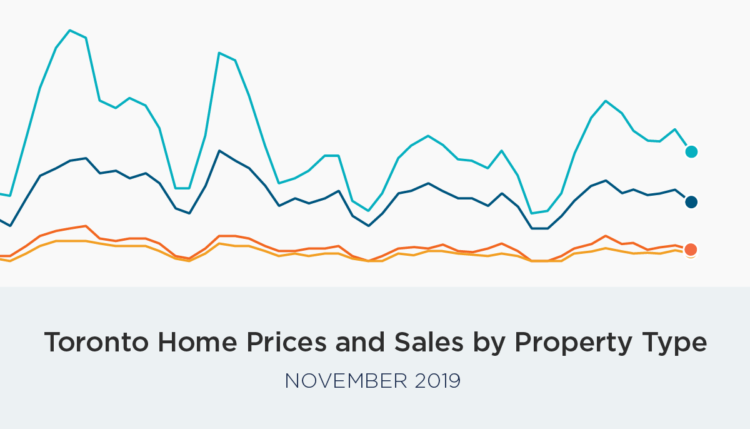
November Toronto home sales and prices
Share78
Tweet
Share
78 Shares


The Greater Toronto Area real estate market continued to experience robust activity throughout the late autumn, as the latest numbers reveal the strongest annual sales and price growth year to date across all home types in November.

According to the latest data from the Toronto Real Estate Board, home sales in the GTA soared 14.2% from the same month in 2018, with a total of 7,090 transactions. The average home price also saw an aggressive uptick, increasing 7.1% to $843,637 across the region, while the MLS Home Price Index – a measure of the value of homes changing hands – increased 6.8%. For both measures, it was the largest increase in the pace of growth experienced in 2019. Part of this is due to the increased volume in high-priced detached home sales, which led the market in terms of activity.

Meanwhile, the number of new listings continued to drop by -17.9%, putting increased pressure on a growing supply and demand gap. That’s resulting in a faster pace of price growth, as well as hotter competition among home buyers, leading to more instances of bidding wars and aggressive offer making. It’s a trend that TREB’s analysts expect to deepen, should new supply not come to market in the near term.

GTA Real Estate Now a Steep Sellers’ Market

Real estate conditions for the GTA as a whole can be classified as a steep sellers’ market with a sales-to-new-listings ratio of 81%, indicating just under 20% of all new listed homes remained on the market by the end of the month. This ratio, which measures the level of competition among buyers, is calculated by dividing the number of sales by the number of new listings over the course of the month. A ratio between 40- 60% indicates a balanced market, while below and above that threshold indicate buyers’ and sellers’ markets, respectively.

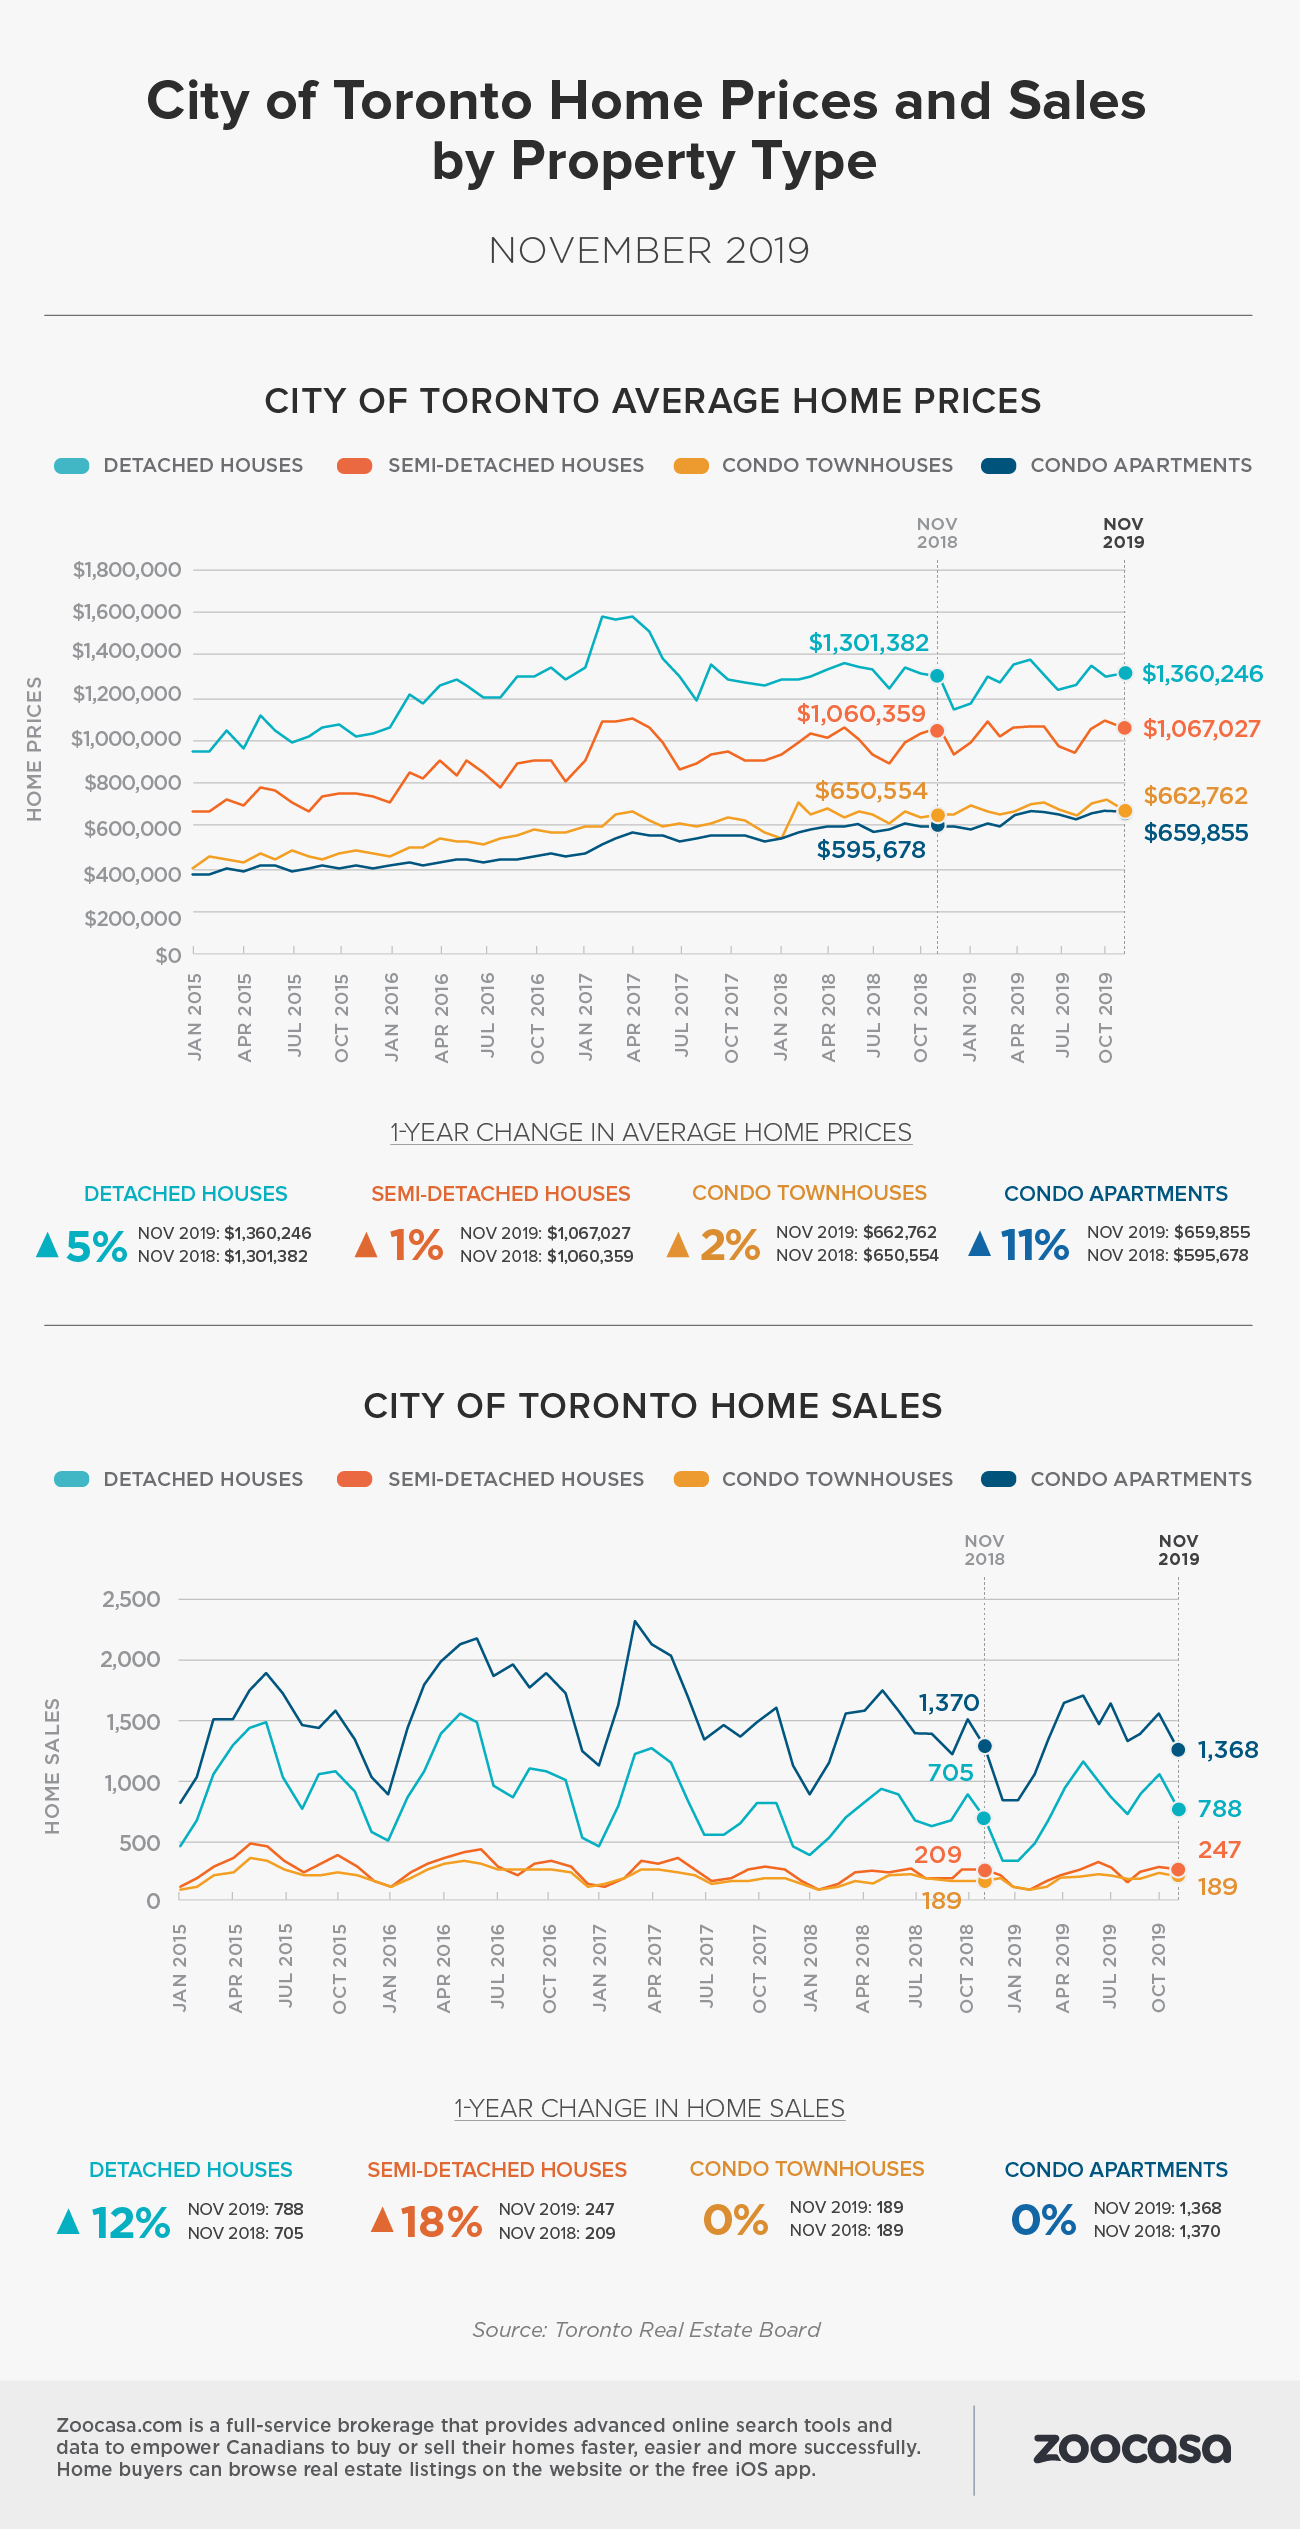
Conditions were similarly steep within the City of Toronto, which experienced a 6.6% increase in sales with 2,718 transactions, while new listings fell 15% at 3,308. That pushed the city’s SNLR to 82%, while the average home price now approaches the $1-million-mark, rising 8.3% to $910,419. Sold house prices in Toronto are now well above that threshold, increasing 12.7% y-o-y to an average of $1,360,246.

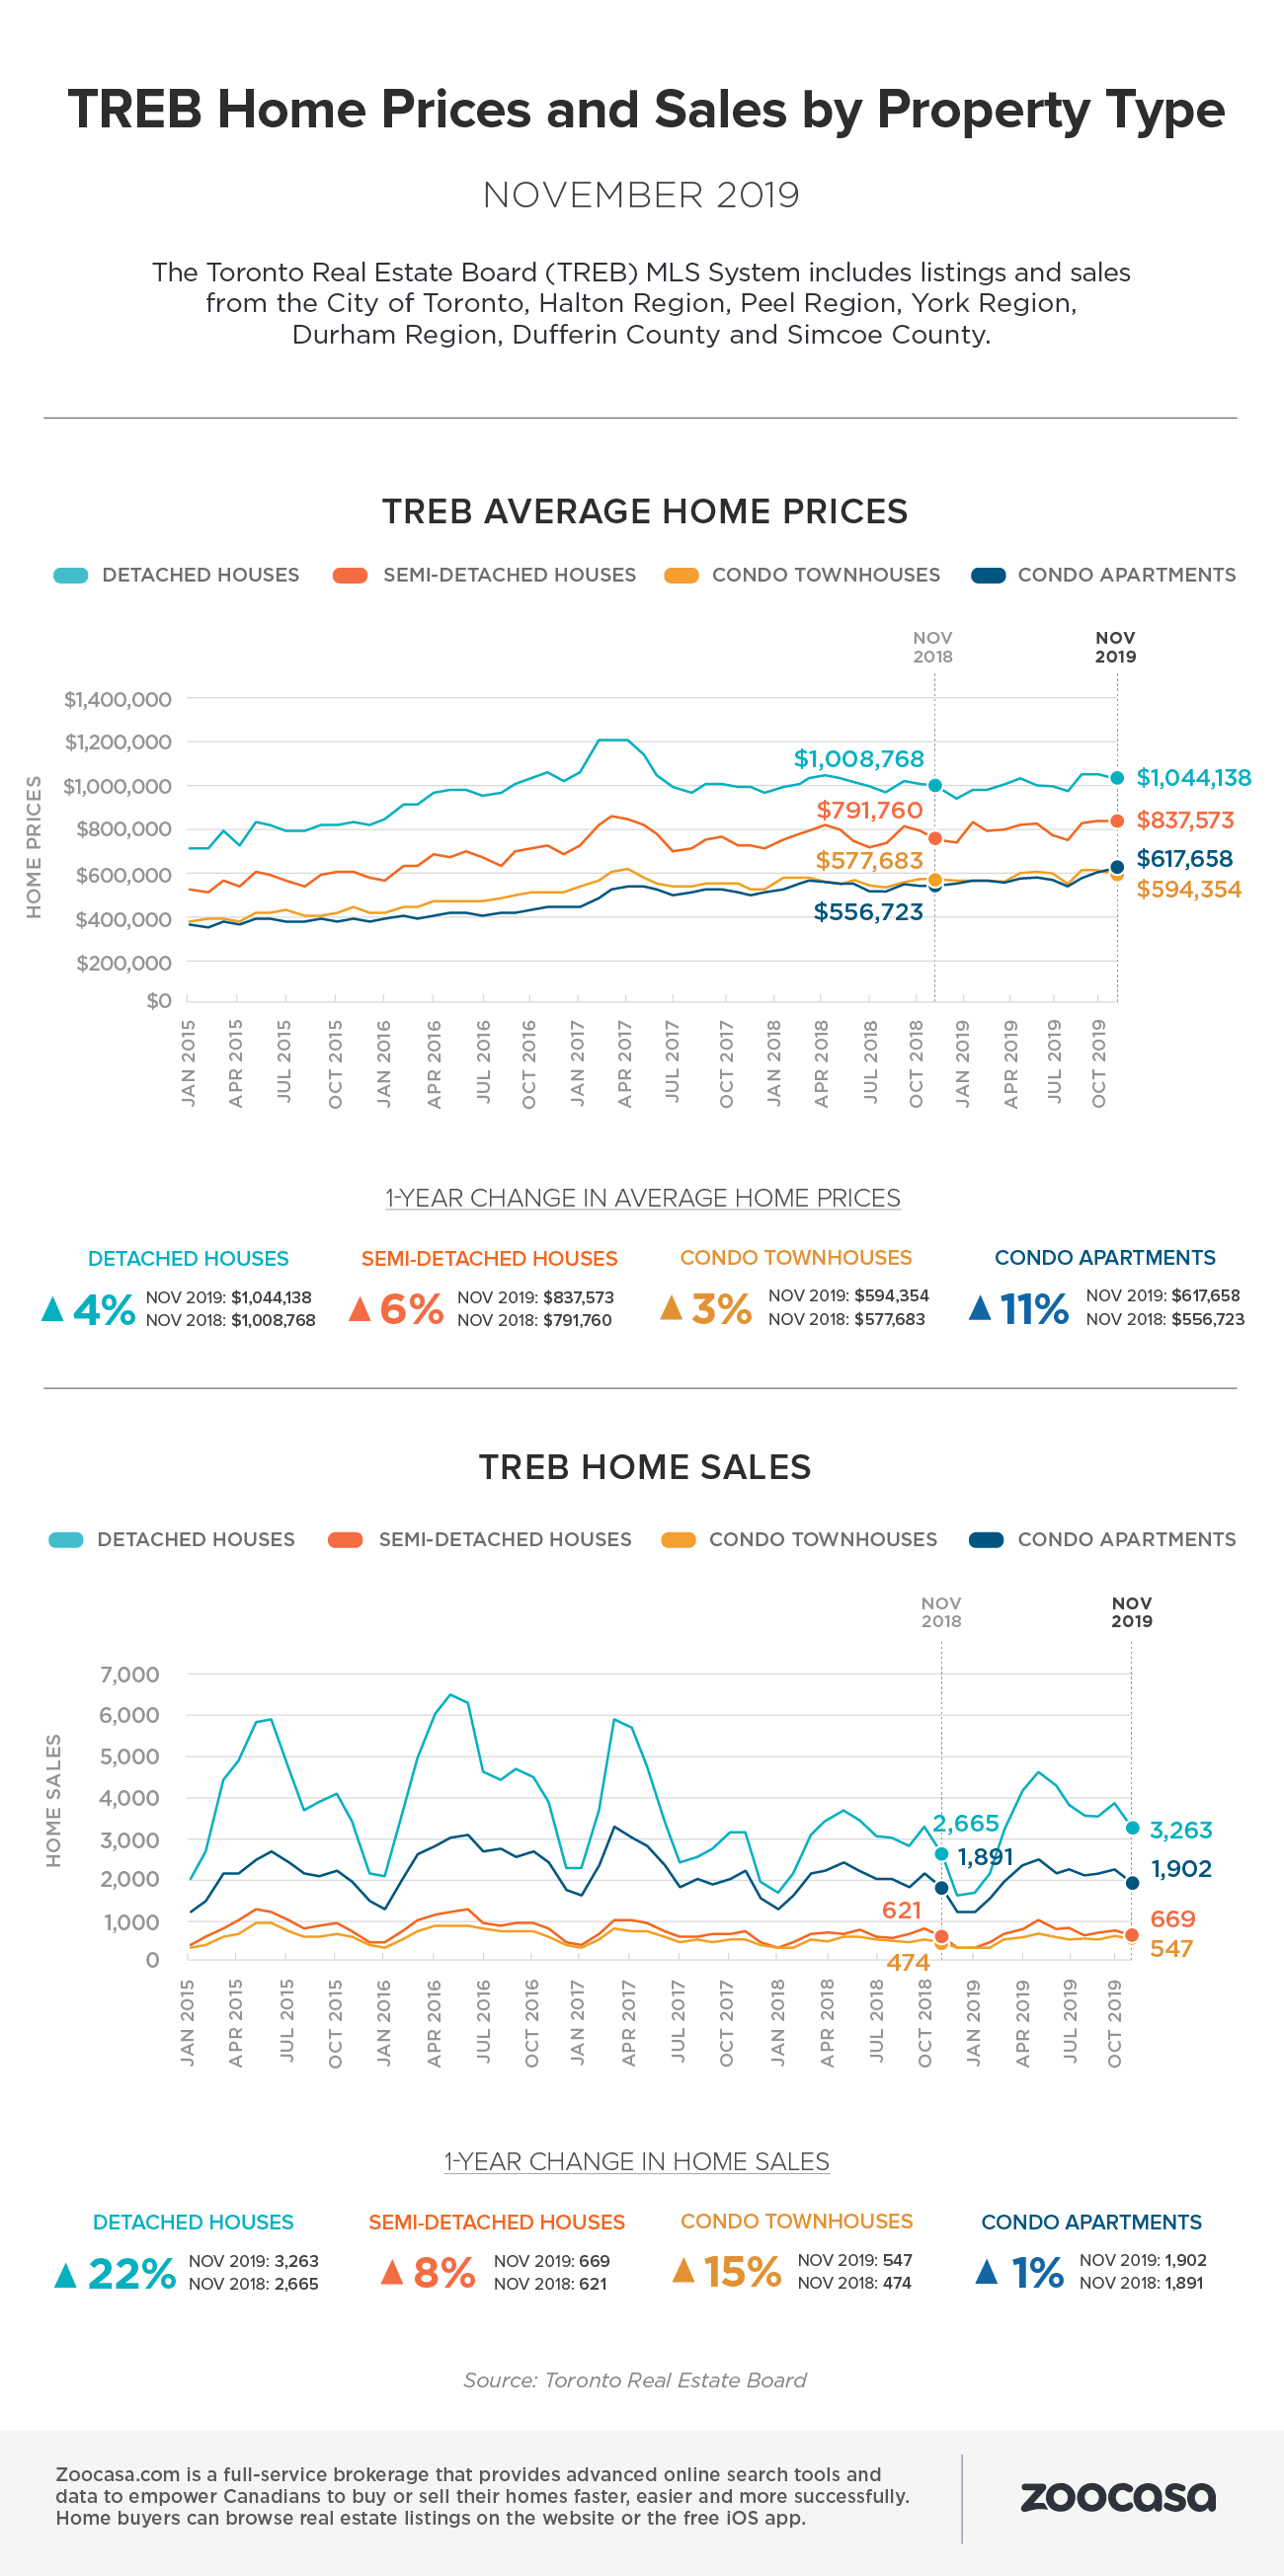
The 905, which includes the Mississauga, Brampton, and Oakville real estate markets, saw the greatest increase in sales with a total of 4,372 homes trading hands, up a whopping 19.5%. Meanwhile, new listings plunged by the same percentage, pushing the SNLR to 81%, and the average home price by 6.8% to $802,120.

“Strong population growth in the GTA coupled with declining negotiated mortgage rates resulted in sales accounting for a greater share of listings in November and throughout the second half of 2019,” says Jason Mercer, TREB’s chief market analyst. “Increased competition between buyers has resulted in an acceleration in price growth. Expect the rate of price growth to increase further if we see no relief on the listings supply front.”

More Buyers Are Returning to Housing Market

As well, the number of qualified buyers entering the market has increased as the effects of recent market-cooling policies are receding; home buyers who were previously sidelined by tougher taxes and mortgage rules are now bouncing back, putting additional pressure on the scant supply of available homes.

Stated TREB President Michael Collins, “An increasing number of home buyers impacted by demand-side policies over the past three years, including the 2017 Ontario Fair Housing Plan and the OSFI mortgage stress test, have moved back into the market for ownership housing. Based on affordability and strict mortgage qualification standards, many buyers may have likely adjusted their preferences, changing the type and / or location of home they ultimately chose to purchase.”

Check out the infographics below to see how sales and prices have increased across all home types in the 905 and 416 markets in November:
Previous Post

Proven Ways to Capture More Natural Light in Your Home

Next Post

Bank of Canada Holds Rates Steady Once Again in December Announcement

Penelope Graham

Penelope Graham

Penelope Graham is the Managing Editor at Zoocasa, and has over a decade of experience covering real estate, mortgage, and personal finance topics. Her commentary on the housing market is frequently featured on both national and local media outlets including BNN Bloomberg, CBC, The Toronto Star, National Post, and The Huffington Post. When not keeping an eye on Toronto's hot housing market, she can be found brunching in one of the city's many vibrant neighbourhoods, travelling abroad, or in the dance studio.

Related Posts

Vancouver from the sea wall with view of buildings and ocean
Affordability

Here’s What $500K Buys You Across Canada in 2026

September 7, 2026
trreb august 2026 home sales
Canada

Tightening Toronto Inventory Could Benefit Sellers This Fall: TRREB 

September 3, 2026
Renting

New Condo Sales Just Fell 60% — What It Means for Toronto Renters in 2027

August 29, 2026

Blog Search

No Result
View All Result

Newsletter Sign-up

Join a community of 130,000+ subscribers. Don't miss important real estate news, market data, and buying and selling tips.

Recent Articles

What Happens If a Home Fails Inspection? 3 Legal Paths Buyers Can Take

September 18, 2026
agent accelerator accountability coach oriana mehden

Finding Your ‘Why’: How Coach Oriana Helps Agents Build Their Careers With Agent Accelerator

September 17, 2026
man working minimum wage job in kitchen

How Many Hours of Minimum-Wage Work Does It Take to Cover Rent in 50 Cities Across America?

September 16, 2026
CREA august 2026 report canadian flag

CREA: National Home Sales Dip in August As Market Braces For Impact

September 15, 2026

Featured Listings

Enchanted forest scene with a tiny moss-covered stone cottage, glowing doorway, giant trees, mushrooms, and a rustic wooden bridge, evoking quiet wonder.

6 Unique Homes in the US With Features You Won’t Find in a Typical Listing

August 25, 2026

You’d Never Guess These Were Churches: 5 Canadian Homes With Remarkable Histories

August 13, 2026
Luxurious Mediterranean-style villa at dusk, lit warmly with lanterns. Features arched doorways, ornate windows, and lush greenery creating an inviting ambiance.

5 Spanish Revival Homes That Capture Arizona’s Most Iconic Architectural Style

June 30, 2026
A fairytale-like castle stands majestically atop a lush, forested hill. Background features a serene lake and quaint village under a partly cloudy sky.

6 Jaw-Dropping Estates That Look Straight Out of a Royal History Book

June 24, 2026
first-time home buyer programs and rebates

Social Media

250 The Esplanade Suite 408 Toronto, ON M5A 4J5

Stay Connected

  • Blog Home
  • For Buyers
  • For Sellers
  • Real Estate News
  • Mortgage News in Canada
  • Free Guides (PDF)
  • Real Estate Infographics
No Result
View All Result

Zoocasa © 2007–2022. The trademarks MLS®, Multiple Listing Service® and the associated logos are owned by The Canadian Real Estate Association (CREA) and identify the quality of services provided by real estate professionals who are members of CREA.