
A new mid-month report from Zoocasa.com now reveals a short-term snapshot of shifting market trends
Market conditions have rapidly changed in the Greater Toronto Area following the announcement of the Ontario Fair Housing Plan in April, when panicked sellers listed en-masse and trepidatious buyers put their home searches on hold. However, consecutive months of autumn data have hinted at stabilizing market conditions, as the flood of new listings slowed, and buyer demand was piqued by softening prices and greater choice.
Related Read: GTA September Home Sales Fall 35%
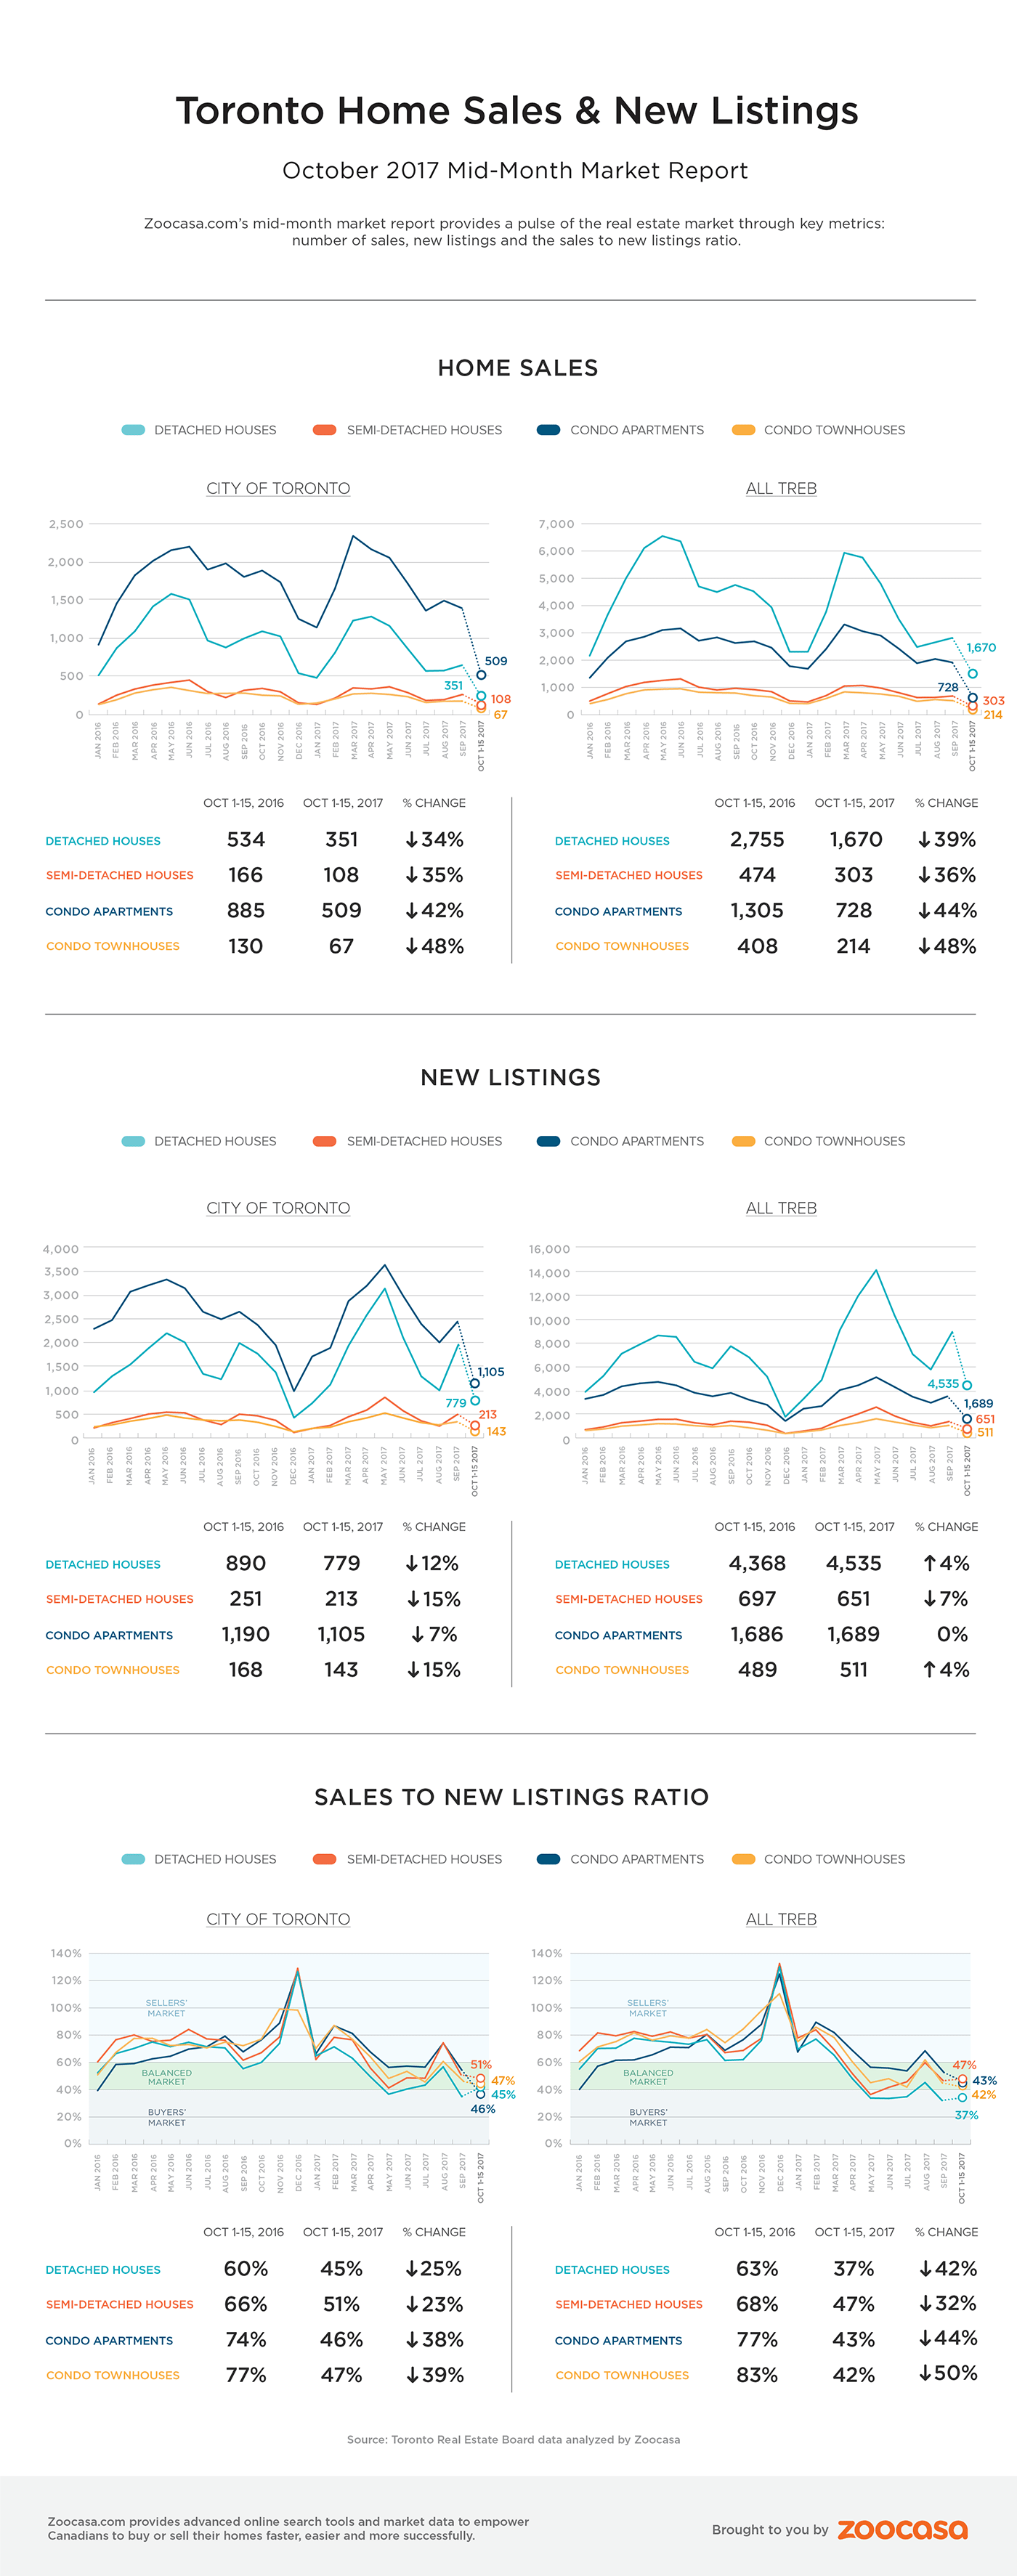
However, the market can change drastically over the course of two weeks, with demand fluctuating wildly for specific home types in various regions. To give home buyers and sellers a timely pulse on the market, Zoocasa has unveiled its mid-month data report, which tracks sales and listings metrics between the 1st and 15th of every month. Check out how mid-month October activity compares to 2016 trends in the infographic below:
A Month-to-Month Breakdown
When assessing how the market is performing, comparing data month over month is the best way to grasp short term trends. Keeping in mind that sales and listings activity can change in the second half of the month compared to the first, here’s how the first 15 days of October 2017 compare to half of September’s total market activity:
It’s still a buyer’s market: Overall, the sales-to-new-listings ratio for the Greater Toronto Area slipped to 36.1 per cent – down 2 per cent from the month before. Conditions were slightly tighter at 41.9 per cent within the City of Toronto, though still firmly in balanced territory. According to the Canadian Real Estate Association, a sales-to-new-listings ratio between 40 – 60 per cent indicates balanced conditions, with buyer’s and seller’s markets below and above that range, respectively.
Sales continue to slide: Sales have fallen a further 25 per cent within the 416 compared to half of the activity in September. Demand was slightly higher throughout the GTA, at 16.3 per cent.
Detached home demand is appearing to recover: Single-family houses bore the brunt of the spring market downturn; following the rules, buyers became less willing to engage in extremely competitive tactics such as bully offers and bidding wars, and a new foreign buyer tax is speculated to have reduced demand in York region. However, mid-October sales are on the uptick, up 0.93 per cent in the city and 11.1 per cent in the GTA.
Townhouse sales plunge: Demand for GTA and Toronto townhomes continues to decline, falling 47.8 per cent in the 416, and a whopping 62.1 per cent in the GTA. Condo demand also seems to be softening, with 33.4 per cent fewer city sales, and 29.4 per cent down in the GTA. This is counter to reports of buyers flocking to lower-priced home types for greater affordability. Semi-detached homes saw strong suburban activity, rising 12.8 per cent in the GTA, but fell 20 per cent within city limits.
Fewer listings are coming to market: One of the reasons the GTA fell rapidly from seller’s to buyer’s market territory was the flood of new inventory on the market throughout the spring. That flood is slowing to a trickle with 22.4 per cent fewer homes listed so far in October in Toronto, and relatively flat at 0.67 per cent throughout the GTA.
What are your thoughts on the mid-October Toronto data? Leave us a comment below!