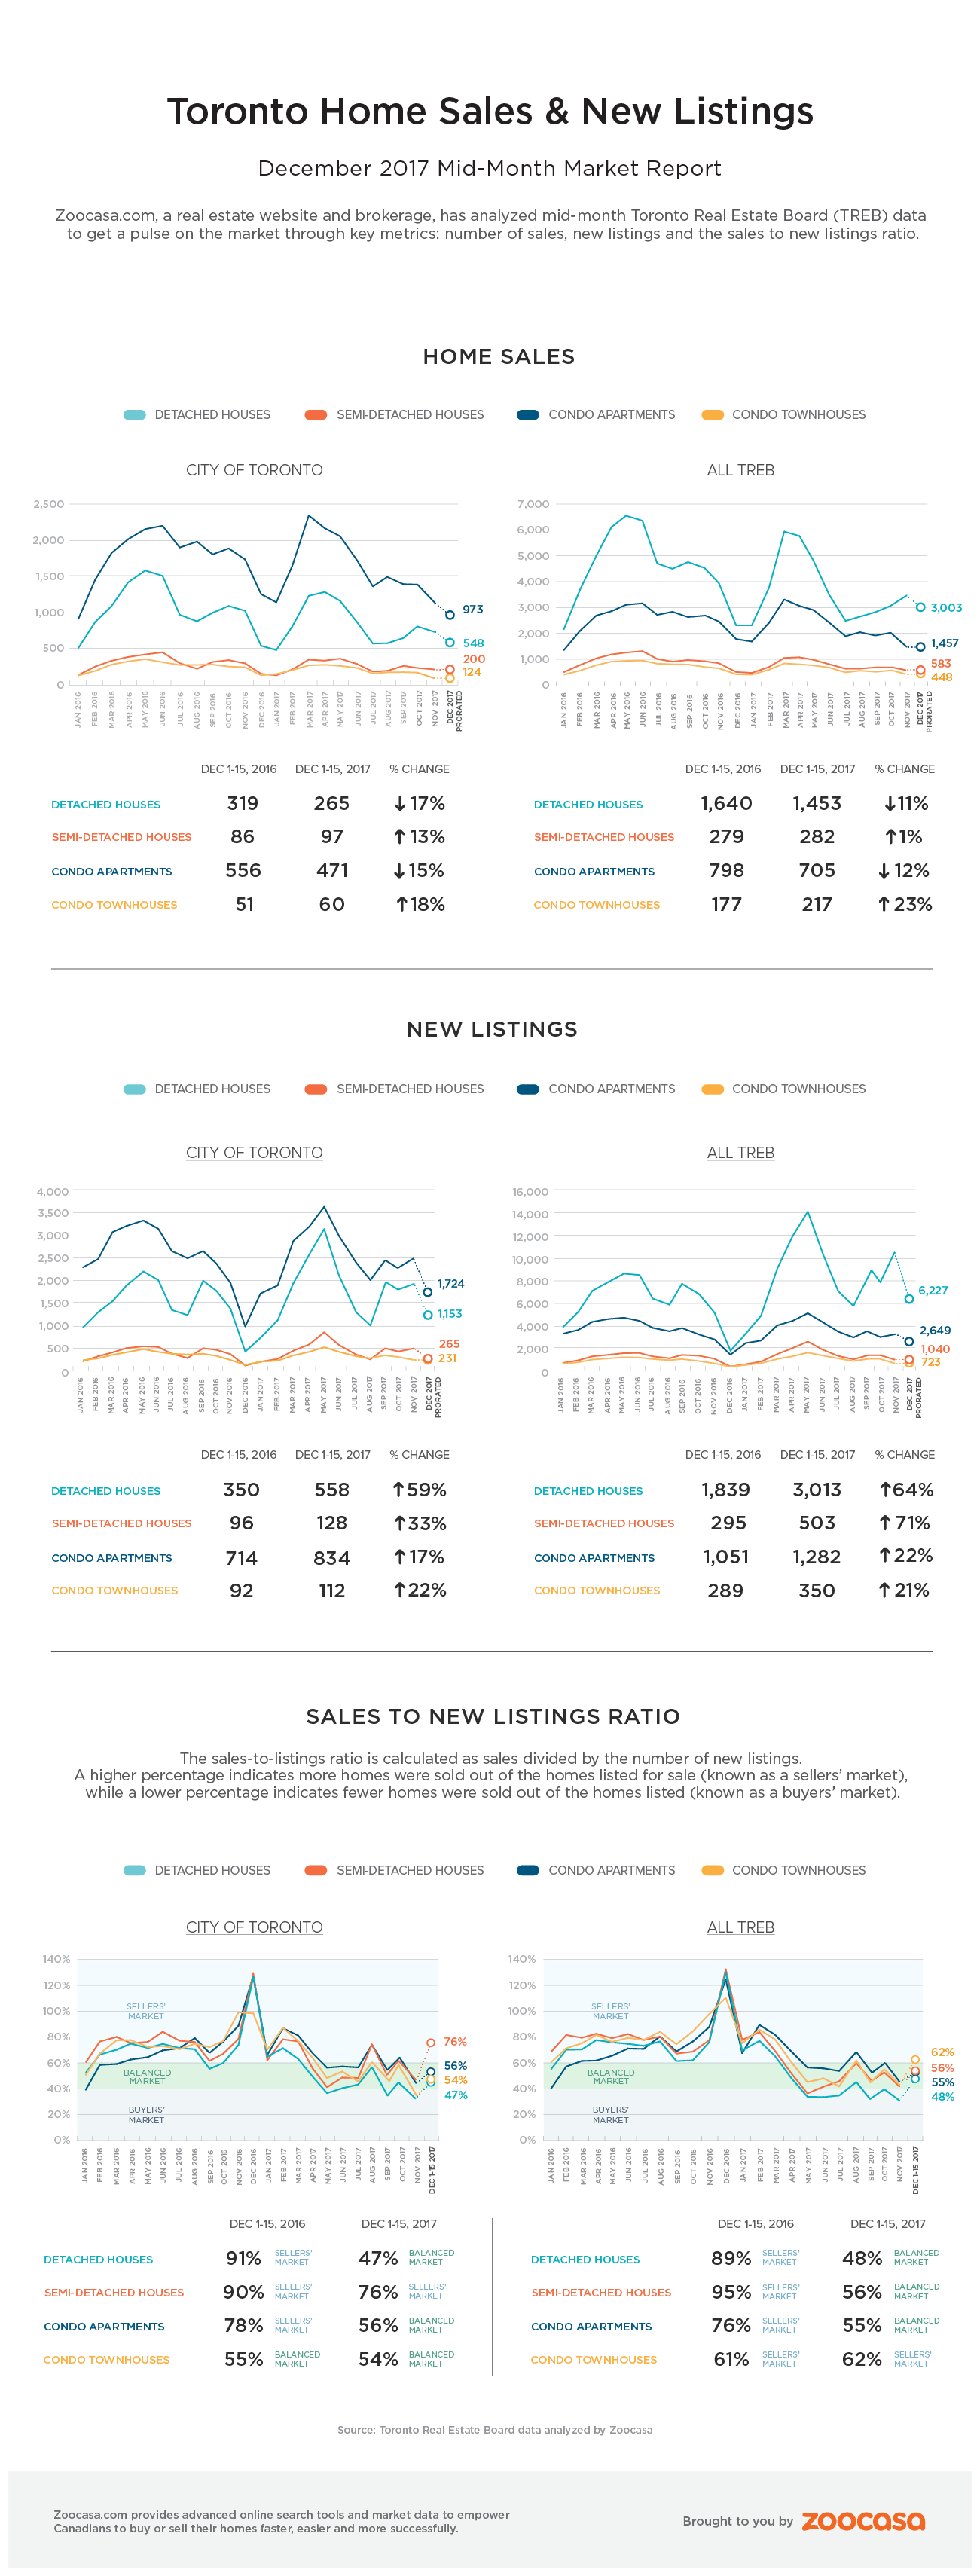
The fallout from the Ontario Fair Housing Plan, which was announced in the spring, is carrying through the holiday season as data shows a reversal in buyer’s conditions in the detached segment from the same time last year. According to Zoocasa’s mid-month December report, which is compiled using sales data collected by the Toronto Real Estate Board between the first and 15th day of the month, the house market has plunged from extremely steep seller’s conditions to balanced status.
The numbers reveal the new-sales-to-listings ratio fell by nearly half in the GTA, from 89 per cent in 2016 to 48 per cent year over year. The difference is even more pronounced in the City of Toronto, with a ratio of 47 per cent compared to a whopping 91 per cent last year. (The Canadian Real Estate Association considers a sales-to-new-listings ratio between 40 to 60 per cent to be balanced territory, with below and above as buyer’s and seller’s markets, respectively.) So, what’s different this year?
An Unseasonal Surge of Inventory
December is typically a slower month for real estate; sellers are usually loathe to list this time of year as cold weather, holiday vacations, and fewer buyers make it a less ideal month to market a home. This was evident mid-December of 2016, when the number of new listings plunged 66 per cent from 5,109 in November to just 1,736 the following month. This thrust the 2016 holiday real estate market into daunting seller’s territory, as even reduced month over month sales of 41.9 per cent couldn’t offset the lack of homes available for sale.
However, sellers seem all the more eager to list this year, a lingering effect following the implementation of the Fair Housing Plan. This has effectively reversed the tight December inventory trend, with a 64-per-cent surge throughout the total TREB area, and 59 per cent in the 416. Coupled with 11 and 17-per-cent sales declines respectively, house buyers have far more choice – and are contending with much less competition – than the same time last year when the market was ramping up to its eventual March peak.
Check out the year over year difference in the infographic below: