
Anyone looking to buy, sell, or invest in a property over the last two years can attest that the Canadian housing market has been a wild ride. Home sales and price growth boomed at an unprecedented rate over the course of the pandemic, coming to a head this April with buyer activity up triple percentage digits, and the average Greater Toronto Area home selling for over a million dollars.
However, as pandemic-era buyer urgency has faded and lockdown restrictions begin to lift, the market has calmed considerably over the summer months, to the extent that some experts are calling it a correction. The July data for the GTA reveals sales have dipped below year-ago levels for the first time in 2021, by -14.9%. While the average home price is still up by 12.6% to $1,062,256, that’s the smallest pace of growth of the year, and has been on the decline for three consecutive months.
Slowing price growth is welcome news for GTA home buyers, many of whom have weathered blistering bidding wars and rapidly increasing sold-versus list-prices. Sellers on the other hand, may feel they have missed their opportunity to sell at top profit and are taking a wait-and-see approach before listing their home.
Will this summer slump persist as we enter into the fall market, or will sales and prices experience a rebound?
Prices Poised to Rise Nearly 5% by October
According to 10-year historical data, Zoocasa projects the average home price in the GTA to hit $1,114,387 in October 2021, an increase of 4.91% from July, and a dollar difference of $52,131. Sales volume is projected to reach 9,260 transactions, down -1.38% from July, and 130 fewer homes trading hands.
On the lower end of the range, prices are projected to increase 3.61% to $1,100,647, with sales down -7.57% to 8,679. On the high end, prices are projected to increase 6.18% to $1,127,879, with sales hitting 9,882, up 5.25%.
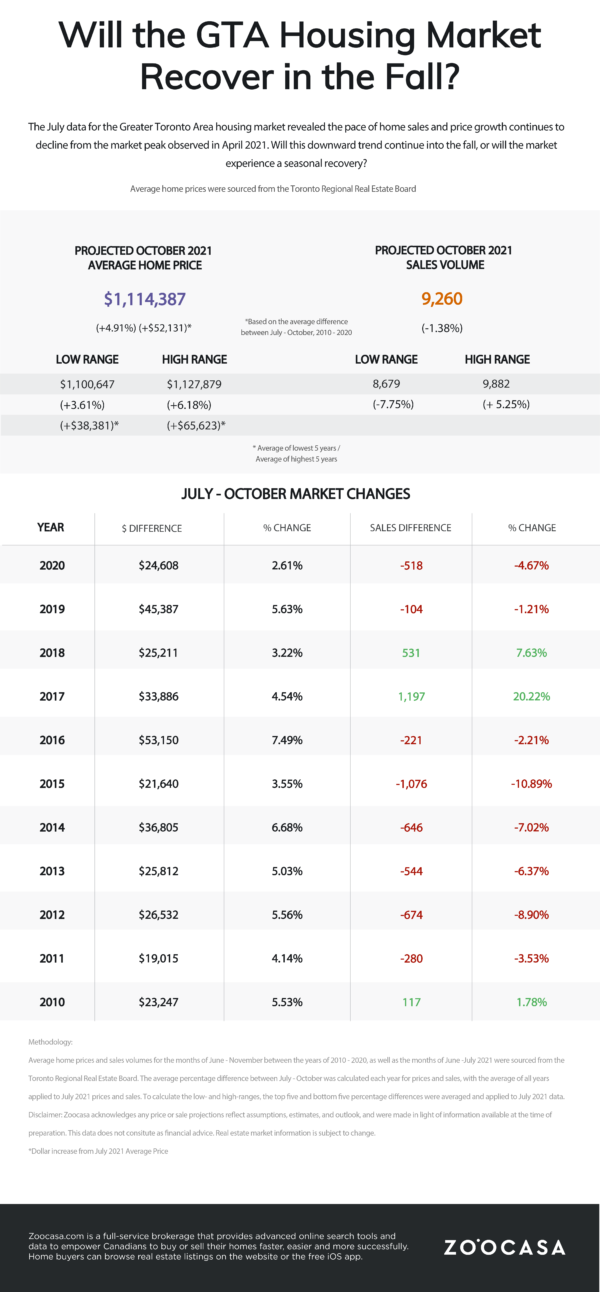
To determine these projections, Zoocasa analyzed sales and prices for the summer (June – August) and fall (September – November) periods between 2010 – 2020. The percentage difference between July (the historic low summer point) and October (the historic fall high point) was then calculated for average prices and sales volumes each year. Those averages were then applied to July 2021 price and sales data to project October 2021 average price and sales numbers. A high and low range was also calculated by averaging the percentage differences in the top five and bottom five years and applying that to the July 2021 data.
Looking for Homes in the GTA? Check out all listings
What Does This Mean for Home Buyers and Sellers?
While it appears today’s market conditions are considerably softer than they were in the spring, it’s important to keep the historical trend in mind – beyond the impact of the pandemic, July can actually be considered above-average in terms of sales and price growth. Sales remain 9.2% above 2019 levels with prices at an all-time high.
Zoocasa agent Mina Chand, who specializes in the GTA, says lack of homes for sale has been a main challenge facing the the buyer pool, and is the key to declining sales numbers, among other buyer considerations. “The very reason that the sales have decreased is the cause of competition in the market for my buyers,” she says. “Today’s low sales are due to low inventory and not lack of demand.”
“However,” she adds, “not every house listed is getting the same traction. Now that prices are back to cyclical increments, and interest rates remain at an all time low, buyers are taking their time to choose the right property. Listings that are high in demand due to their location, school rating, and accessibility are low in supply and, therefore, have more competition.”
According to the TRREB July report, the number of new listings fell by -30% last month, further putting the squeeze on prospective buyers. As the decline in new supply has outstripped that of sales, that’s set the stage for a competitive sellers’ market throughout the GTA with a sales-to-new listings ratio of 74.8%. Today’s buyers are likely to continue to experience bidding wars and multiple offer scenarios, and will need to be savvy with their offer strategy in what remains a hot market.