April was a rather dour month for the Toronto housing market, as unseasonably chilly weather kept prospective buyers inside, and away from open houses. Fortunately, May is shaping up to be a breath of fresh air, as mid-month numbers reveal strong improvement on both a month-over-month and yearly basis.
The data, provided by the Toronto Real Estate Board and compiled by Zoocasa, indicates sales and new listings are up across all home types in the first two weeks of May, compared to the same time period in April.
Related Read: April Ice Storm Puts Freeze on Spring Sales
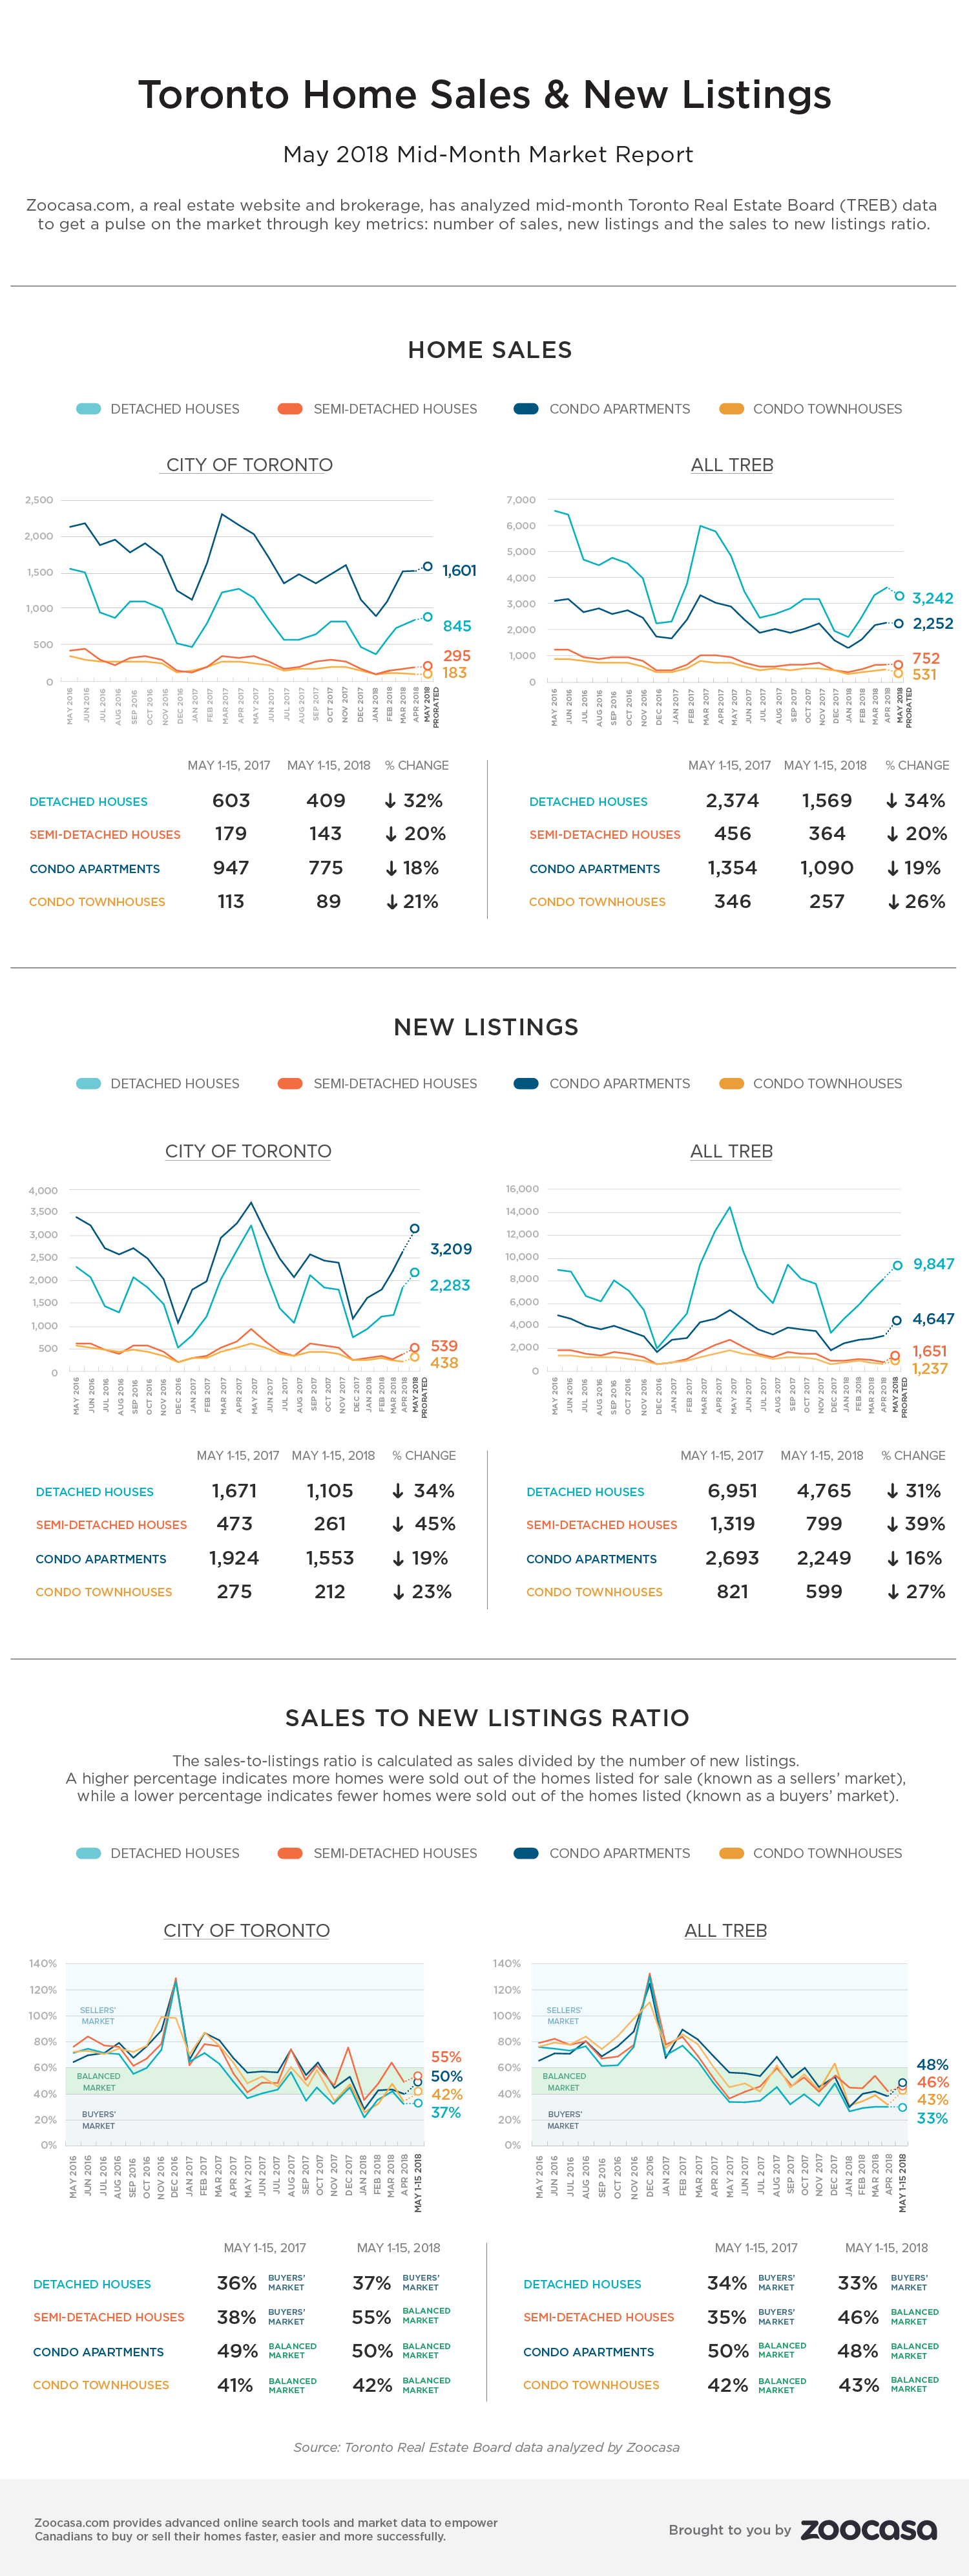
Month-over-month sales rose 30 per cent throughout the entire TREB-tracked region, and 39 per cent in the City of Toronto from April, though still well below 2017 levels, down 31 and 22 per cents, respectively.
New listings rose 17 per cent in TREB and 18 per cent within the 416, though the uptick in monthly sales activity offset the flow of new housing stock; as a result, market conditions became a bit more competitive from the previous month. In the TREB region, the sales-to-new-listings ratio increased from 35 per cent last month to 39, reflecting continued, though slightly tighter, buyers’ market conditions. However, in the city proper, the ratio rose from 38 per cent to 45, making the move from a buyers’ market to balanced.
The sales-to-new listings ratio is a measure used to determine the level of competition in a certain market. It is calculated by dividing the number of sales by the number of new listings introduced over a specific time frame. A ratio between 40 – 60 per cent is considered balanced, while below and above that threshold indicate buyers’ and sellers’ markets, respectively.
Today’s buying conditions are roughly the same compared to the same time last year at 39 and 42 per cents; the market had recently plunged from high balanced and sellers’ conditions (with ratios of 59 per cent in TREB and 62 per cent in the 416), following the implementation of the province of Ontario’s Fair Housing Plan on April 20, 2017.
May 2018 Mid-Month Market Report
Condo Apartments: Month-Over-Month Leaders
Multi-family and high-rise homes saw the greatest growth in sales compared to the same time period in April, up 46 per cent throughout the total GTA and recovery a full 48 per cent in the City of Toronto. New listings rose 17 and 19 per cents in both regions; while remaining balanced with ratios of 48 and 50 per cents, each became roughly 10 per cent more competitive for condo sales, up from 49 and 40 per cent respectively, in April.
The condo segment also experienced the smallest annual declines, with 19 and 18 per cent fewer sales than in the first two weeks of May 2017.
Condo Townhouses: Fewer New Listings
Condo townhouses continue to see healthy month-over-month growth, with sales up 28 per cent throughout the TREB region, and 46 per cent in the 416. However, this housing type – of which there are the fewest in the region – saw the smallest increase in new product coming to market, with just 5 per cent more homes being listed in the GTA, and an increase of 22 per cent in the 416.
This boost in sales, coupled with fewer new listings, firmed the segment up to balanced territory at 43 and 42 per cent, from the buyers’ market where it has lingered throughout the first half of the year.
Semi-Detached: Better Balance
Conditions have improved in the semi-detached homes territory, which is now considered a balanced market compared to the buyers’ conditions that prevailed in the second portion of 2017.
While year-over-year sales are down 20 per cent throughout both the total TREB region and 416, they’ve improved 30 and 35 per cents, respectively, since the first half of April.
Listings increased by 18 and 16 per cents, though remain well below what was available last year by double digits.
Detached: A Continued Improvement
The most expensive housing type, detached houses experienced the greatest sales decline in the months following the introduction of the FHP. While annual activity has yet to catch up with 2017 levels, the demand for single-family houses continues to grow on a monthly basis from last year’s dip, with 21 per cent more changing hands throughout the TREB region, and 25 per cent more in the City of Toronto.
While the detached segment is still considered a buyers’ market, conditions have firmed up slightly since April, with ratios of 33 and 37 per cents, compared to 32 and 34 per cents. That’s on par with buying conditions in 2017 at 34 and 36 per cents, having taken a drastic fall from the steep sellers’ markets (58 and 64 per cents) that defined single-detached homes throughout the past two years.