Boomers, Gen-Xers or Millennials – who has had the toughest time breaking into the Toronto real estate market?
The best decade in which to buy a home in the 416 has long been a point of debate as market observers point to the 80s’ double-digit interest rates and stagnant wages as foils to today’s soaring prices and speculative demand. And yet, with 34.7 per cent of all Canadians aged between 20 and 34 living at home with their parents, it’s evident the issue far exceeds their taste for avocado toast.
Related Read: 12 Toronto Condos That Sell for $1,000 PSF
To determine which era was easiest on home buyers’ wallets, Zoocasa crunched the numbers, assessing average Toronto home prices, interest rates, inflation, as well as median total household incomes (adjusted for inflation) over time.
The findings reveal that – all breakfast preferences considered – there are a few key financial challenges facing this decade’s crop of buyers. Here, the top four generational home buying affordability myths, busted:
What Was the Best Decade to Buy a Home in Toronto?
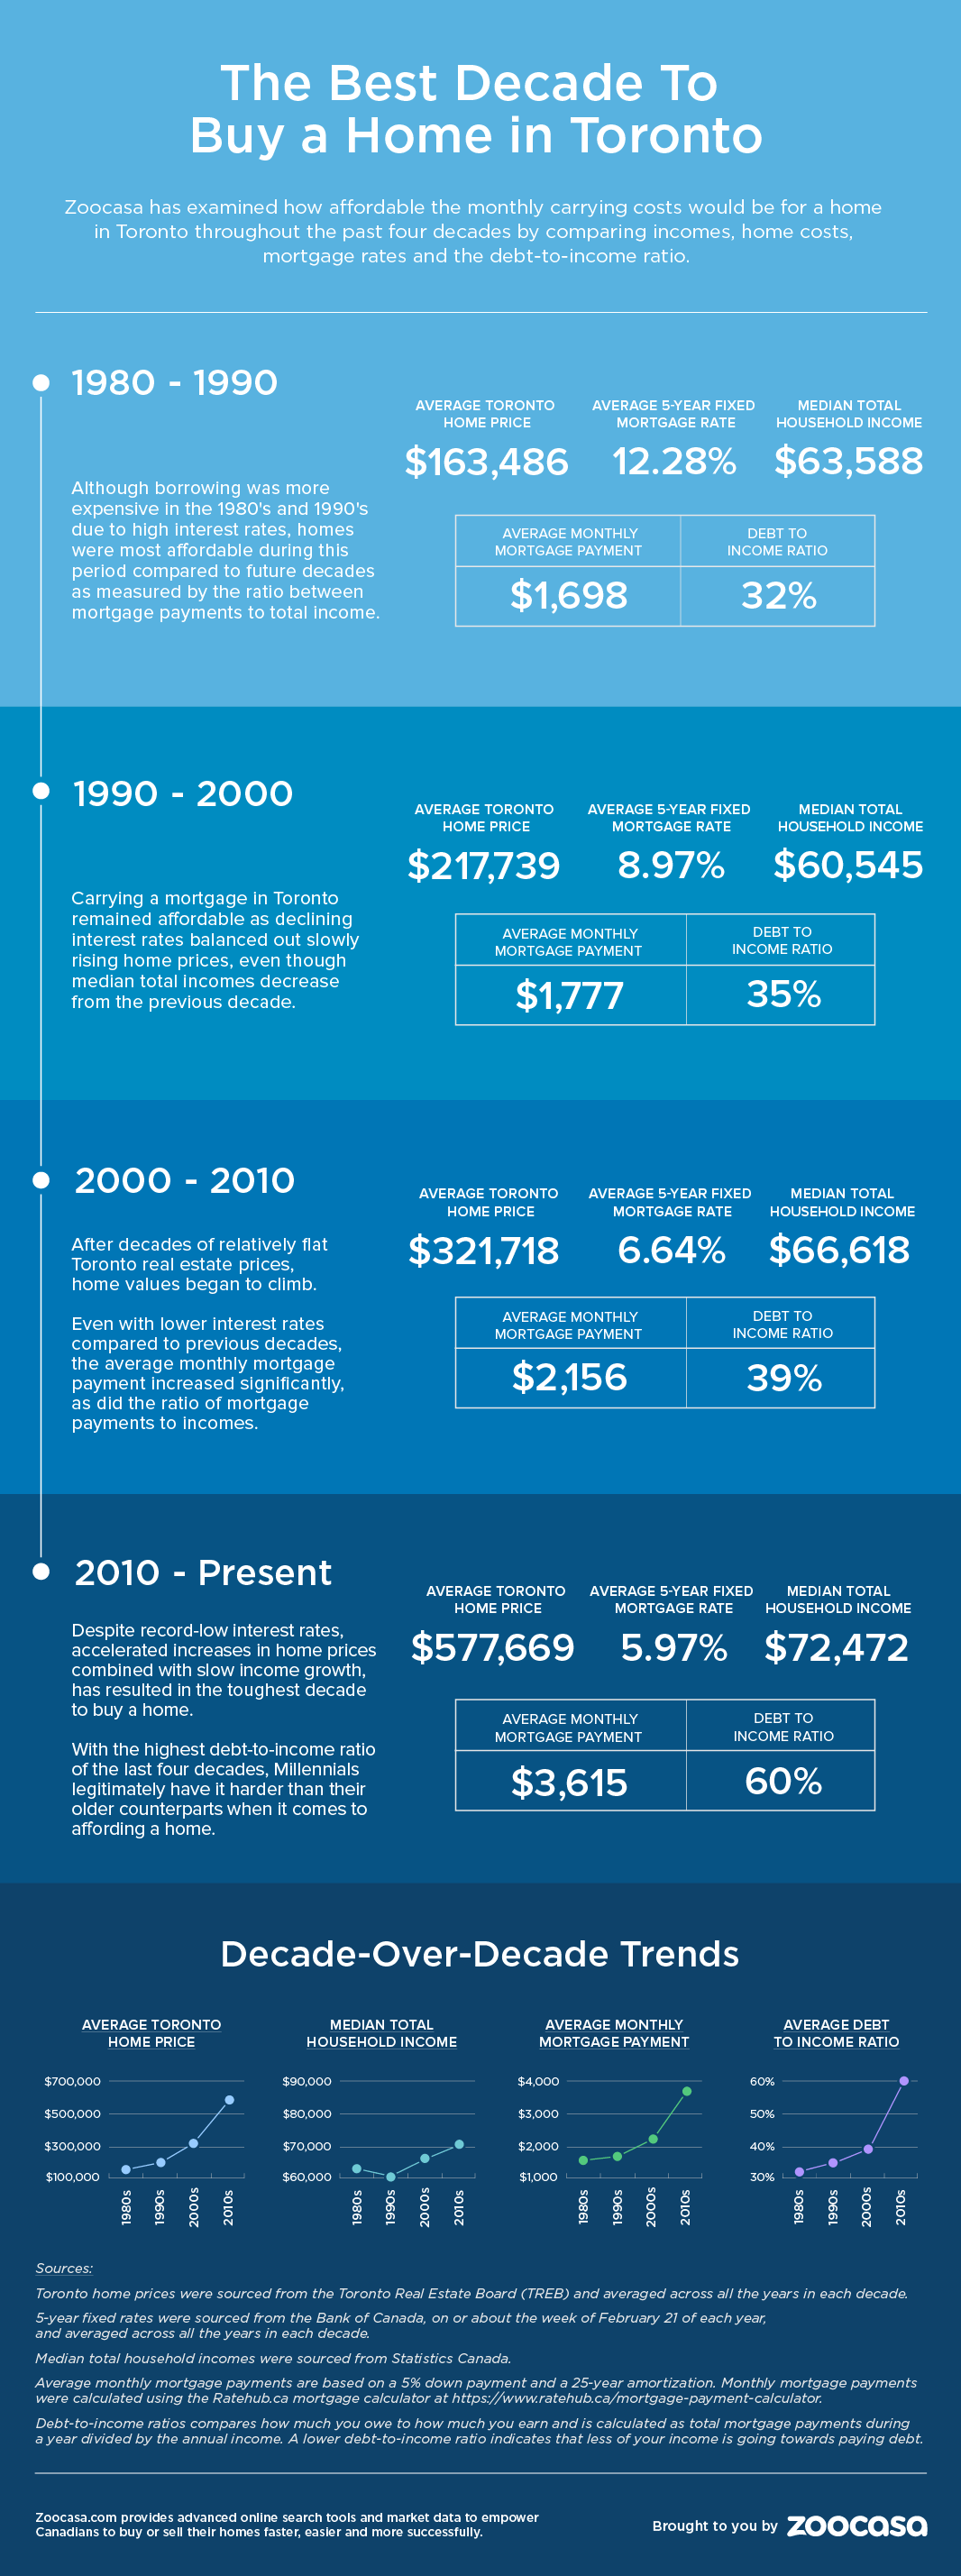
Myth 1 – The 80s had a much higher cost of borrowing
Yes, interest rates were much higher in the 1980’s, hovering in the high teens throughout the decade and into the 1990’s. However, when the widening relationship between the median household income and average home prices are taken into account, it’s evident that Toronto home prices have well outpaced the savings offered by record low interest rates.
Myth 2 – Income growth has compensated for rising home prices
The total median income in the 416 has grown 33 per cent, from $58,700 to $78,280, between the 1980’s and the 2010’s to date. However, that’s just a drop in the bucket compared to the 693-per-cent (!) increase in average home prices, which have ballooned 21 times over from $101,626 to $806,071 – it costs an average of an additional $704,445 to purchase a home today, despite earning only $19,580 more.
Myth 3 – Lower rates make today’s mortgage payments more affordable
Using the RateHub mortgage calculator, it’s determined that the average mortgage payment in 1980 (assuming a minimum 5-per-cent down payment and 25-year amortization), would have been $1,698, before rising to $1,777 in the 1990’s, $2,156 in 2000, and $3,615 in the 2010’s to date. That’s a difference of $1,917, at a growth rate of 112.8 per cent, and well outstripping that of inflation and wages.
Myth 4 – It’s easier for today’s homeowners to pay off debt
The ability to service debt can be determined by an individual or household’s debt-to-income ratio, which measures how much is owed compared to what is earned. Evidence from mortgage loan studies reveals a direct correlation between having a high ratio and struggling to pay the mortgage each month – namely for borrowers with ratios exceeding 43 per cent. Historically, this ratio clocks in at 32 per cent in the 1980’s, 35 per cent in the 1990’s, and 38 per cent in the 2000s. However, it then accelerates at a rapid pace to 59 per cent in the 2010s, indicating the level of debt carried by households has expanded in line with rising home prices. The findings demonstrate that, even with the double-digit interest rates of the 1980s, mortgage payments had a smaller impact on total household expenses than they do today.
Related Read: Best Canadian Markets for Buying a Home on One Income
Methodology:
- Average Toronto home price by year sourced from the Toronto Real Estate Board (TREB).
- Average interest rates sourced from the Bank of Canada, for five-year fixed rates on or about the week of February 21 of each year.
- Average median total household income and inflation rate sourced from Statistics Canada
- Figures were tracked for each year, and then averaged out by decade as below.
| Decade | Average 5-Year Fixed Mortgage Rate | Average Toronto Home Price | Average Inflation Rate | Median Total Household Income |
| 2010- Present | 5.97% | $577,669 | 1.65% | $72,472 |
| 2000-2010 | 6.64% | $321,718 | 2.10% | $66,618 |
| 1990-2000 | 8.97% | $217,739 | 2.33% | $60,545 |
| 1983-1990 | 12.28% | $163,486 | 4.55% | $63,588 |