Early spring real estate conditions continue to fall short by double digits from the records broken in 2017, as March data reveals a nearly 40-per-cent plunge in sales.
The report from the Toronto Real Estate Board states only 7,228 homes changed hands last month, compared to 11,954 the previous year. That follows two consecutive months of declines since the start of 2018, and is down 17.6 per cent from the 10-year average.
The number of homes listed for sale also tightened 12.4 per cent, with 14,866 homes placed on the market. However, despite less choice, buyers are enjoying softer, more wallet-friendly home prices, which have dropped 14.3 per cent from last year’s high, to an average of $784,558.
Related Read: Best Canadian Markets for Buying a Home on One Income
Board Says Slower Activity is Expected
Slower sales and price activity is par for the course in early 2018, falling in line with what the real estate board had predicted for the first quarter, says TREB President Tim Syrianos, who points to the ongoing adjustment period to new real estate and mortgage regulations implemented last April and this January.
“TREB stated in its recent market outlook report that Q1 sales would be down from the record pace set in Q1 2017,” he stated in the board’s release. “The effects of the Fair Housing Plan, the new OSFI-mandated stress test and generally higher borrowing costs have prompted some buyers to put their purchasing decision on hold. Home sales are expected to be up relative to 2017 in the second half of the year.”
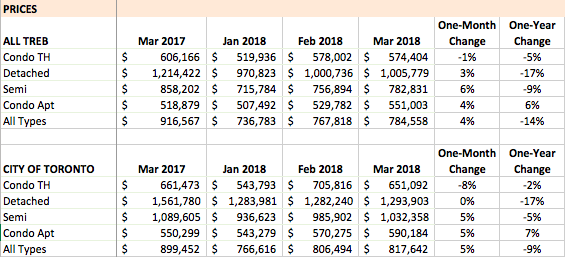
Lower home prices can largely be attributed to falling detached home values – the most expensive housing type, and the hardest hit by the new regulations. The luxury market has also declined considerably, with half as many sales for homes in the $2-million-and-up range.
Price Change Per Home Type
A Tale of Two Markets
Jason Mercer, TREB’s director of market analysis, says it’s no surprise this spring season pales in comparison to last, when the GTA market was gripped by unsustainable price growth and record-breaking sales.
“Right now, when we are comparing home prices, we are comparing two starkly different periods of time: last year, when we had less than a month of inventory versus this year with inventory levels ranging between two and three months,” he says. “It makes sense that we haven’t seen prices climb back to last year’s peak. However, in the second half of the year, expect to see the annual rate of price growth improve from Q1, as sales increase relative to the below-average level of listings.”
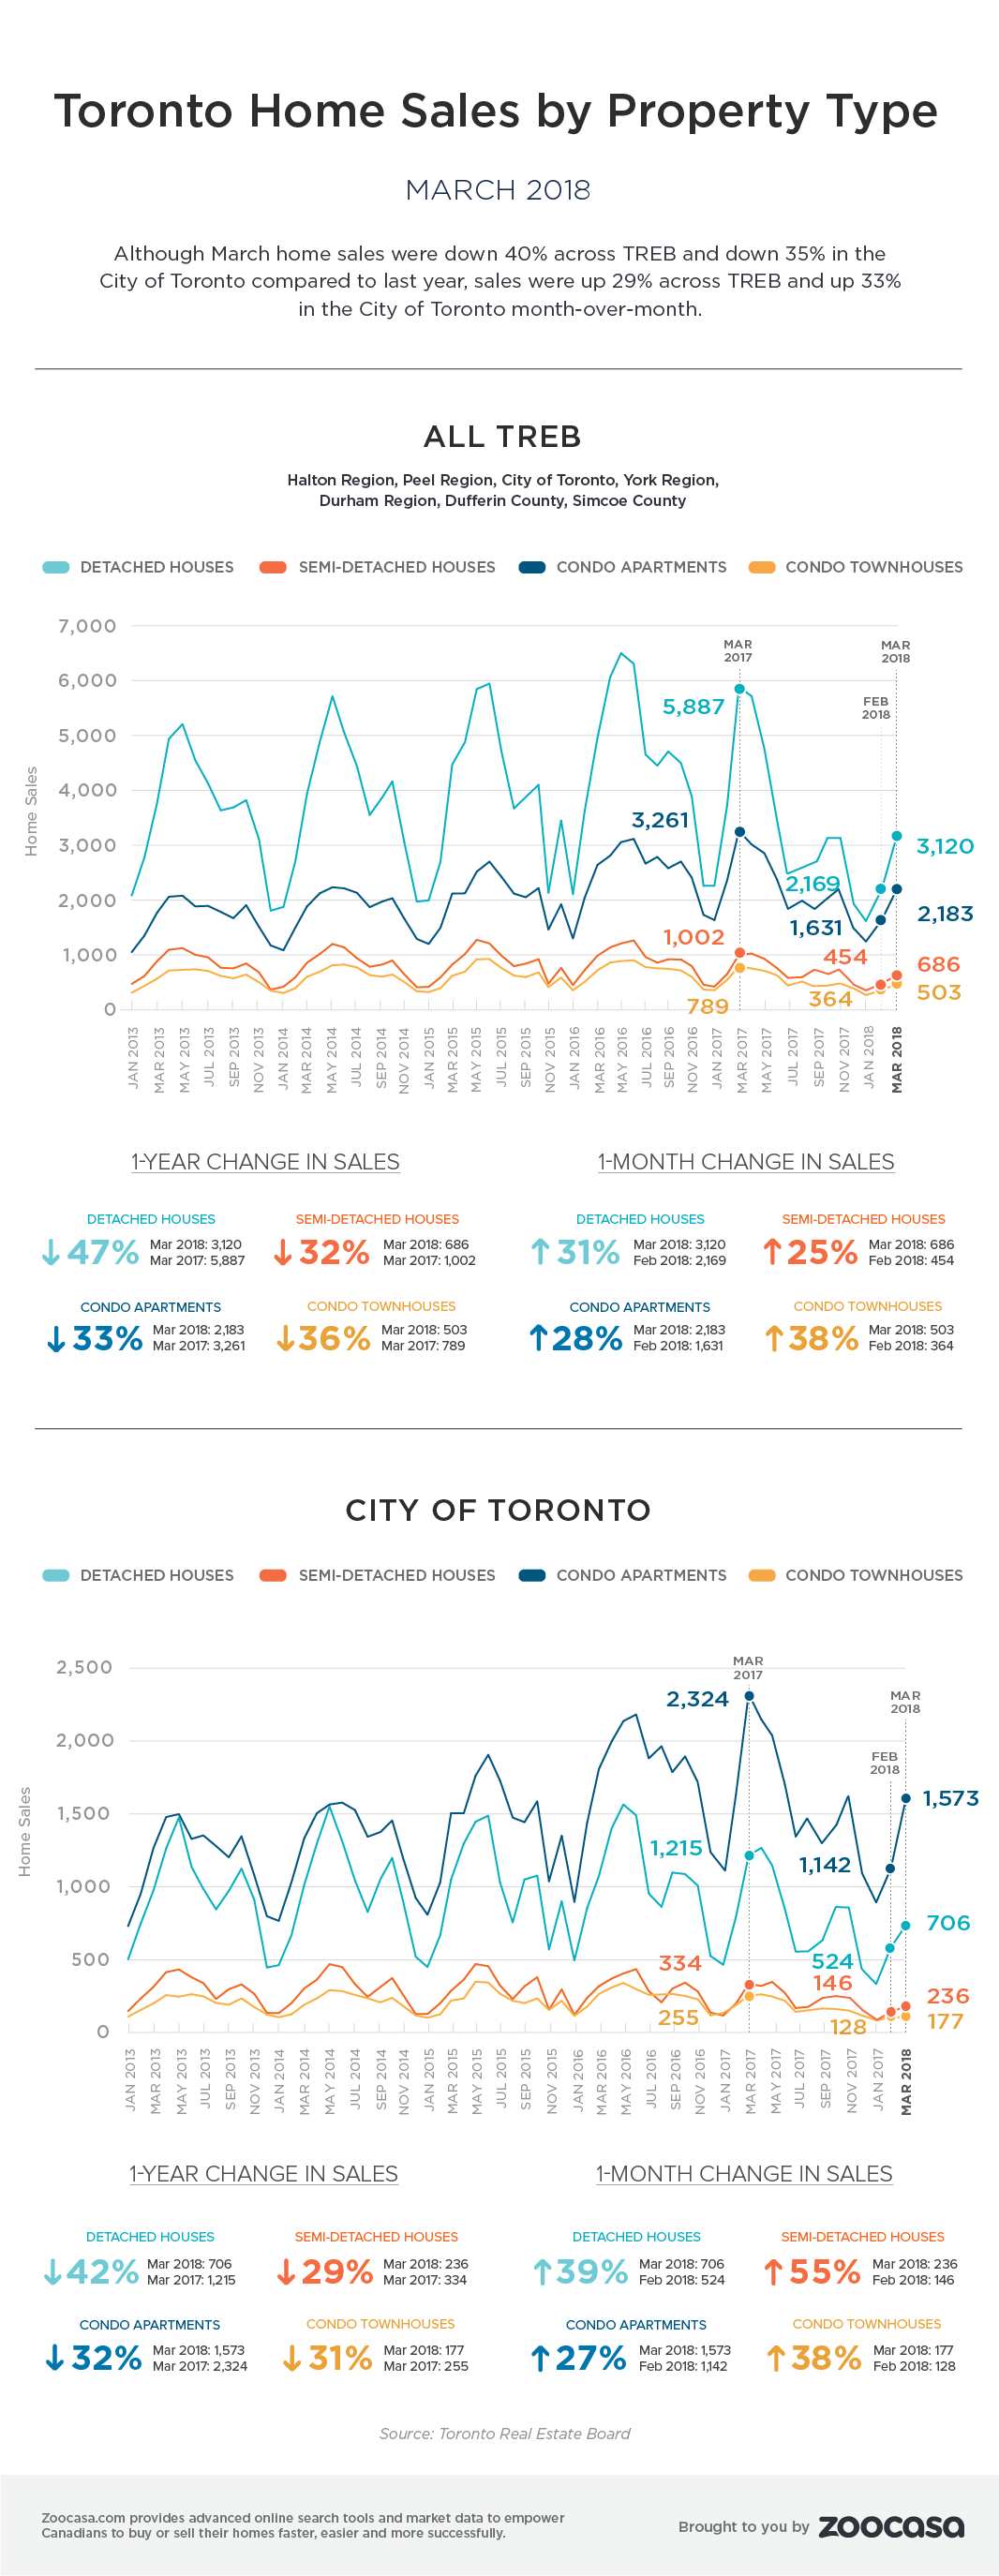
Month Over Month Shows Continued Recovery
It may be a weaker start to the 2018 market, but shorter-term data indicates sales and price growth are already heating up, signalling a competitive spring season. Sales and prices are ramping higher across all home types from February, with the exception of condo townhouses, with saw slight price declines from the previous month.
Detached home sales surged in March, up 31 per cent in the total TREB area, and 39 per cent in the City of Toronto, and relatively flat price growth, at 3 and 0 per cent, respectively.
Semi-detached homes saw the greatest uptick in demand in the 416, with 55 per cent more changing hands and 6-per-cent price growth compared to February, and up 25 per cent in the TREB region, with prices rising 5 per cent.
While sales for condo townhouses remain robust, up 38 per cent in both the TREB and 416 regions, prices softened slightly, at 1 and 8 per cents. Condos continue to perform steadily, with sales increasing 28 and 27 per cent in TREB and 416, and prices up 4 and 5 per cents.
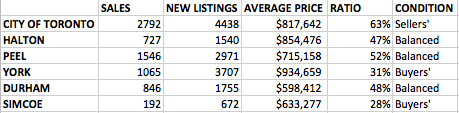
This uptick has returned the City of Toronto back to a sellers’ market, compared to the mostly balanced and buyers’ conditions found throughout the TREB-tracked markets. This is determined by the region’s sales-to-new-listings ratio, which indicates how many of the newly-listed homes for sale are being sold. A ratio between 40 – 60 per cent is considered balanced, while ratios below and above that range indicate buyers’ and sellers’ conditions, respectively.
Sales-to-New-Listings Ratios by Region