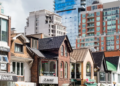

Townhouses are the Goldilocks of Canadian real estate. They’re the perfect in-between of a cozy apartment and a sprawling detached home that requires a small inheritance and a lot of luck. The townhouse is that elusive just-right middle ground: the square footage a growing family actually needs, a patch of grass to call your own, and a garage to park the car.
But the Goldilocks principle didn’t stop at property type. A decade of data shows that finding the just-right market mattered every bit as much as finding the just-right home, and the buyers who figured that out early built five times as much equity as those who didn’t.
Zoocasa tracked townhouse prices across 37 markets in the Greater Toronto Area and 16 in Metro Vancouver from May 2016 to May 2026, then projected how long each market will take to reach a $2 million average at its current rate of growth. The results challenge the assumption that paying more for a prestigious address is ever a sound investment strategy. In comparison, the average price for all types of homes in Canada in April 2026 is $702,079, according to the Canadian Real Estate Association.
Suburban Townhouse Buyers Built Five Times More Equity Than Downtown Buyers
The return on investment between the best and worst-performing markets is surprising when you look closely at the numbers. A family that bought a Toronto Central townhouse for $1,091,848 in 2016 has gained roughly $104,000 in equity over ten years, an increase of under 10%. Meanwhile, a family that drove an hour north to Innisfil and bought for $348,414 is now sitting on a property worth $874,480, a gain of more than $526,000 and a return on investment of a whopping 151%.
Top GTA Suburbs for Townhouse Equity Growth (2016 to 2026)
- Innisfil: Home prices rose from $348,414 to $874,480, creating $526,066 in equity and putting the market just 4 years from a $2 million average.
- Toronto East: Values climbed from $695,949 to $1,219,370, adding $523,421 in equity over ten years and projecting to $2 million in about 6 years.
- Uxbridge: Prices increased from $467,450 to $980,000, generating $512,550 in equity with a projected 7-year path to $2 million.

Top Metro Vancouver Suburbs for Townhouse Equity Growth (2016 to 2026)
- Whistler: Home values jumped from $726,700 to $1,646,800, a $920,100 equity gain and just 2 years from a $2 million average.
- New Westminster: Prices rose from $534,500 to $1,283,600, generating $749,100 in equity and projected to reach $2 million in about 5 years.
- Maple Ridge: Values grew from $363,000 to $868,500, adding $505,500 in equity with a 7-year runway to $2 million.

Why Entry Price Was the Most Important Variable
In 2016, Innisfil was the kind of place people politely called “up-and-coming,” a lakeside town north of Barrie that barely registered on most buyers’ radars. However, buyers could get in at a price that left room to grow, and that affordability attracted the steady stream of new demand needed to drive appreciation over time.
New Westminster followed a similar trajectory on the West Coast. Home values reached $1,283,600 by May 2026 (a $749,100 gain over 10 years), and at that pace, the market is roughly five years away from a $2 million average.
Whistler operates on a different logic entirely. Unlike every other market in this study, it isn’t tied to local wages or commutes to the office. International luxury capital, vacation rentals, and secondary-home demand drive prices there, and it’s just two years from a $2 million average. It functions less like a housing market and more like a global equity asset.
GTA Townhouse Markets with the Weakest Equity Growth
- Toronto Central: Prices rose from $1,091,848 to $1,195,853, a gain of just $104,005 over ten years, with an estimated 79 years to reach $2 million.
- King: Home values increased from $648,502 to $708,000, adding only $59,498 in equity and pushing the $2 million milestone more than 100 years away.
- Richmond Hill: Prices moved from $802,794 to $851,176, generating only $48,382 in equity over ten years and an estimated 118-year path to $2 million.
Metro Vancouver Townhouse Markets with Slower Equity Gains
- Tsawwassen: Values rose from $609,700 to $916,300, a $306,600 equity gain and an estimated 19 years to reach $2 million.
- Squamish: Prices climbed from $575,700 to $744,200, adding $168,500 in equity and stretching the $2 million target to about 39 years.
- Ladner: Home values went from $614,200 to $727,300, creating $113,100 in equity over ten years and a 60-year runway to $2 million.

Why Affordable Suburbs Are Winning the Townhouse Game
The pattern holds consistently across both regions. Once a market becomes expensive enough, the buyer pool thins, demand weakens, and appreciation slows to a crawl.
Toronto Central and Vancouver West had almost no new townhouse development over the past decade. The land is too expensive to build horizontally, so developers built condos instead. But that scarcity didn’t make existing downtown townhouses more valuable–it made the market stall. Without new communities generating fresh demand, transaction volume in the urban core slowed. Younger buyers, the ones who would have driven appreciation, didn’t wait around. They left.
In Innisfil, Uxbridge, and Maple Ridge, developers had what the downtown core didn’t: room to build. Modern, open-concept townhouse communities with garages and energy-efficient finishes launched at prices families could actually reach. As those homes went up, schools, transit, retail, and community centres followed, transforming these neighbourhoods from commuter outposts into places people genuinely wanted to live.
Equity grows where new money, new infrastructure, and new buyers are actively entering the market. However, moving to the suburbs offered something younger buyers wanted more: a realistic way in.
The Just-Right Market: You Didn’t Need to Flee to the Exurbs to Win the Decade
The Goldilocks principle applies to location, too. The best-performing urban market in the study wasn’t in the core or the outer suburbs. Toronto East buyers paid $695,949 in 2016, less than Toronto Central and more central than markets like Innisfil, and have since gained about $523,421, a roughly 75% increase over ten years. They captured spillover demand from priced-out urban buyers without having to endure a brutal commute.
A similar pattern plays out in Metro Vancouver. A Vancouver West townhouse bought for $1,035,400 grew to roughly $1,331,700, a gain of about $296,300, or under 30%, over ten years. A buyer who chose New Westminster instead entered at nearly half that price and walked away with $749,100 in equity, more than doubling their original investment.
Which Canadian Townhouse Markets Will Hit $2 Million First?
About 24% of all 37 markets analyzed are projected to cross the $2 million threshold within the next decade.
In the GTA, the markets on track include:
- Innisfil (4 years)
- Toronto East (6 years)
- Oakville, Markham, and Uxbridge (7 years)
- Toronto West and East Gwillimbury (8 years)
- Durham Region and Simcoe County (9 years)
- Newmarket, Whitchurch Stouville, New Tecumseth (10 years)
In Metro Vancouver, four of the 16 markets tracked are on the same timeline:
- Whistler (2 years)
- New Westminster (5 years)
- Maple Ridge and Coquitlam (10 years)
At the other end of the spectrum, four markets across both regions are projected to take 50 years or more to reach an average of $2 million. Of the Toronto and Vancouver areas, Ladner sits furthest out at approximately 60 years.
Of course, past performance is never a guarantee of future results, but the last decade made one thing clear. Affordability at entry, not prestige at purchase, was the variable that determined who actually built wealth through townhouses in Canada’s most expensive markets. The families who found their just-right market found their home and a great investment.
Curious about where to find value in today’s townhouse market? Browse listings on Zoocasa and connect with a local agent to start building your plan.
Methodology
This analysis uses average resale prices for townhouses across 37 markets in the Greater Toronto Area and 16 Metro Vancouver markets from May 2016 to May 2026. Equity gain reflects the difference between average prices at the start and end of the study period, before transaction costs and mortgage pay-down. Projections to $2 million are based on each market’s compound annual growth rate over the study period and should be treated as illustrative rather than predictive.