The Greater Toronto Area housing market continued to heat up in July, as more prospective home buyers returned to the market while the supply of available homes for sale declined compared to the same time last year.
The latest data from the Toronto Real Estate Board (TREB) reveals a total of 8,595 transactions took place over the course of the month, marking a 24.3% year-over-year increase. Meanwhile, the number of new listings rose by just 3.7%; that’s put upward pressure on buyers, who now find themselves on the edge of a sellers’ market, with a sales-to-new-listings ratio (SNLR) of 59%. This ratio, which measures the level of competition in a given housing market, is up 10% from July 2018, indicating a widening gap in supply and demand and resulting in a 3.2% increase in the average home price, now at $806,755.
Supply and Demand Imbalances Could Rapidly Heat Prices
TREB CEO John DiMichele says that a growing point of concern
“While the OSFI mortgage stress test has clearly had an impact on the number of home sales over the last year and a half, for most GTA residents the goal of homeowership has not diminished,” he stated. “In fact, we’re seeing growing pent-up demand for ownership housing, especially as the number of GTA households continues to increase by 40,000 to 50,000 due to strong population growth.”
He adds that if left unchecked, a “chronically under-supply marketplace” will continue to push home values to unsustainable heights, though new initiatives from both the City of Toronto and the province to boost supply promise some relief.
Sales Strong Throughout 416 and 905
The improvement in sales activity was felt throughout the GTA, with the most robust growth seen in the 905 markets; transactions in these areas were up 25% in July with 5,485 transactions, outpacing a 2.8% increase in new listings, and pushing the average home price up 4% to $787,937. Buyer conditions also firmed up with an SNLR of 56%.
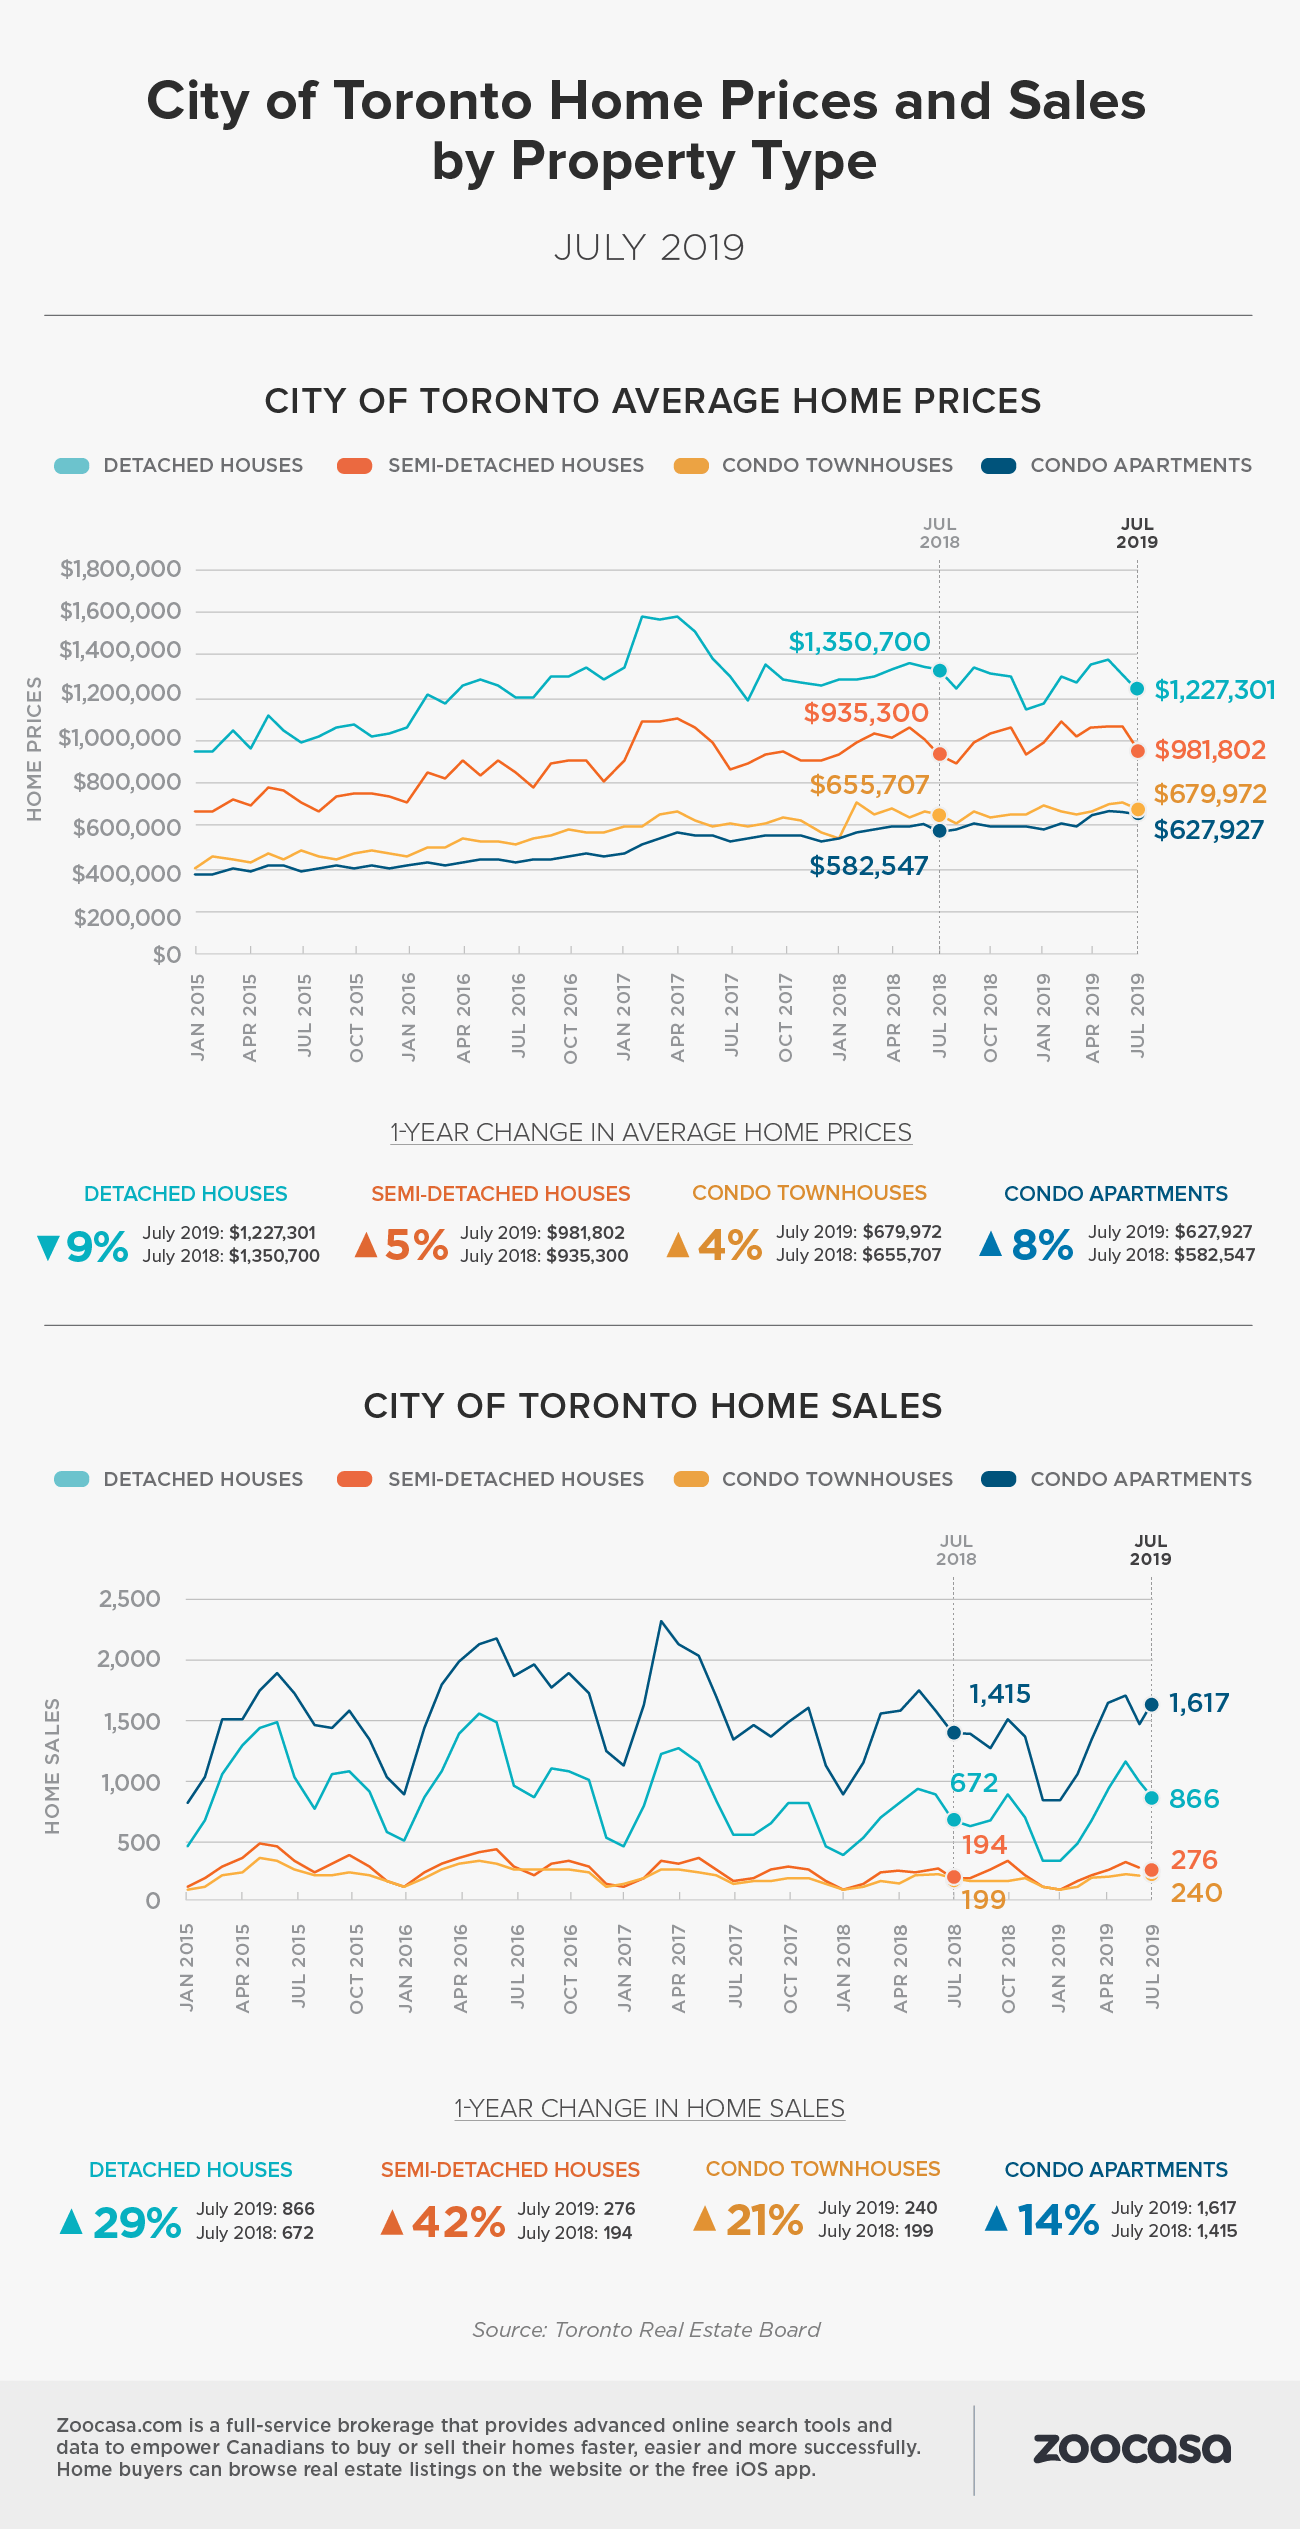
In the City of Toronto proper, sales rose by 20.8% with a total of 3,110 home changing hands. While new listings rose by 5.5%, that’s not enough to satisfy the uptick in demand; as a result, the SNLR sits in sellers’ territory at 65%, and the average home price ticked 1.8% higher to $839,943.
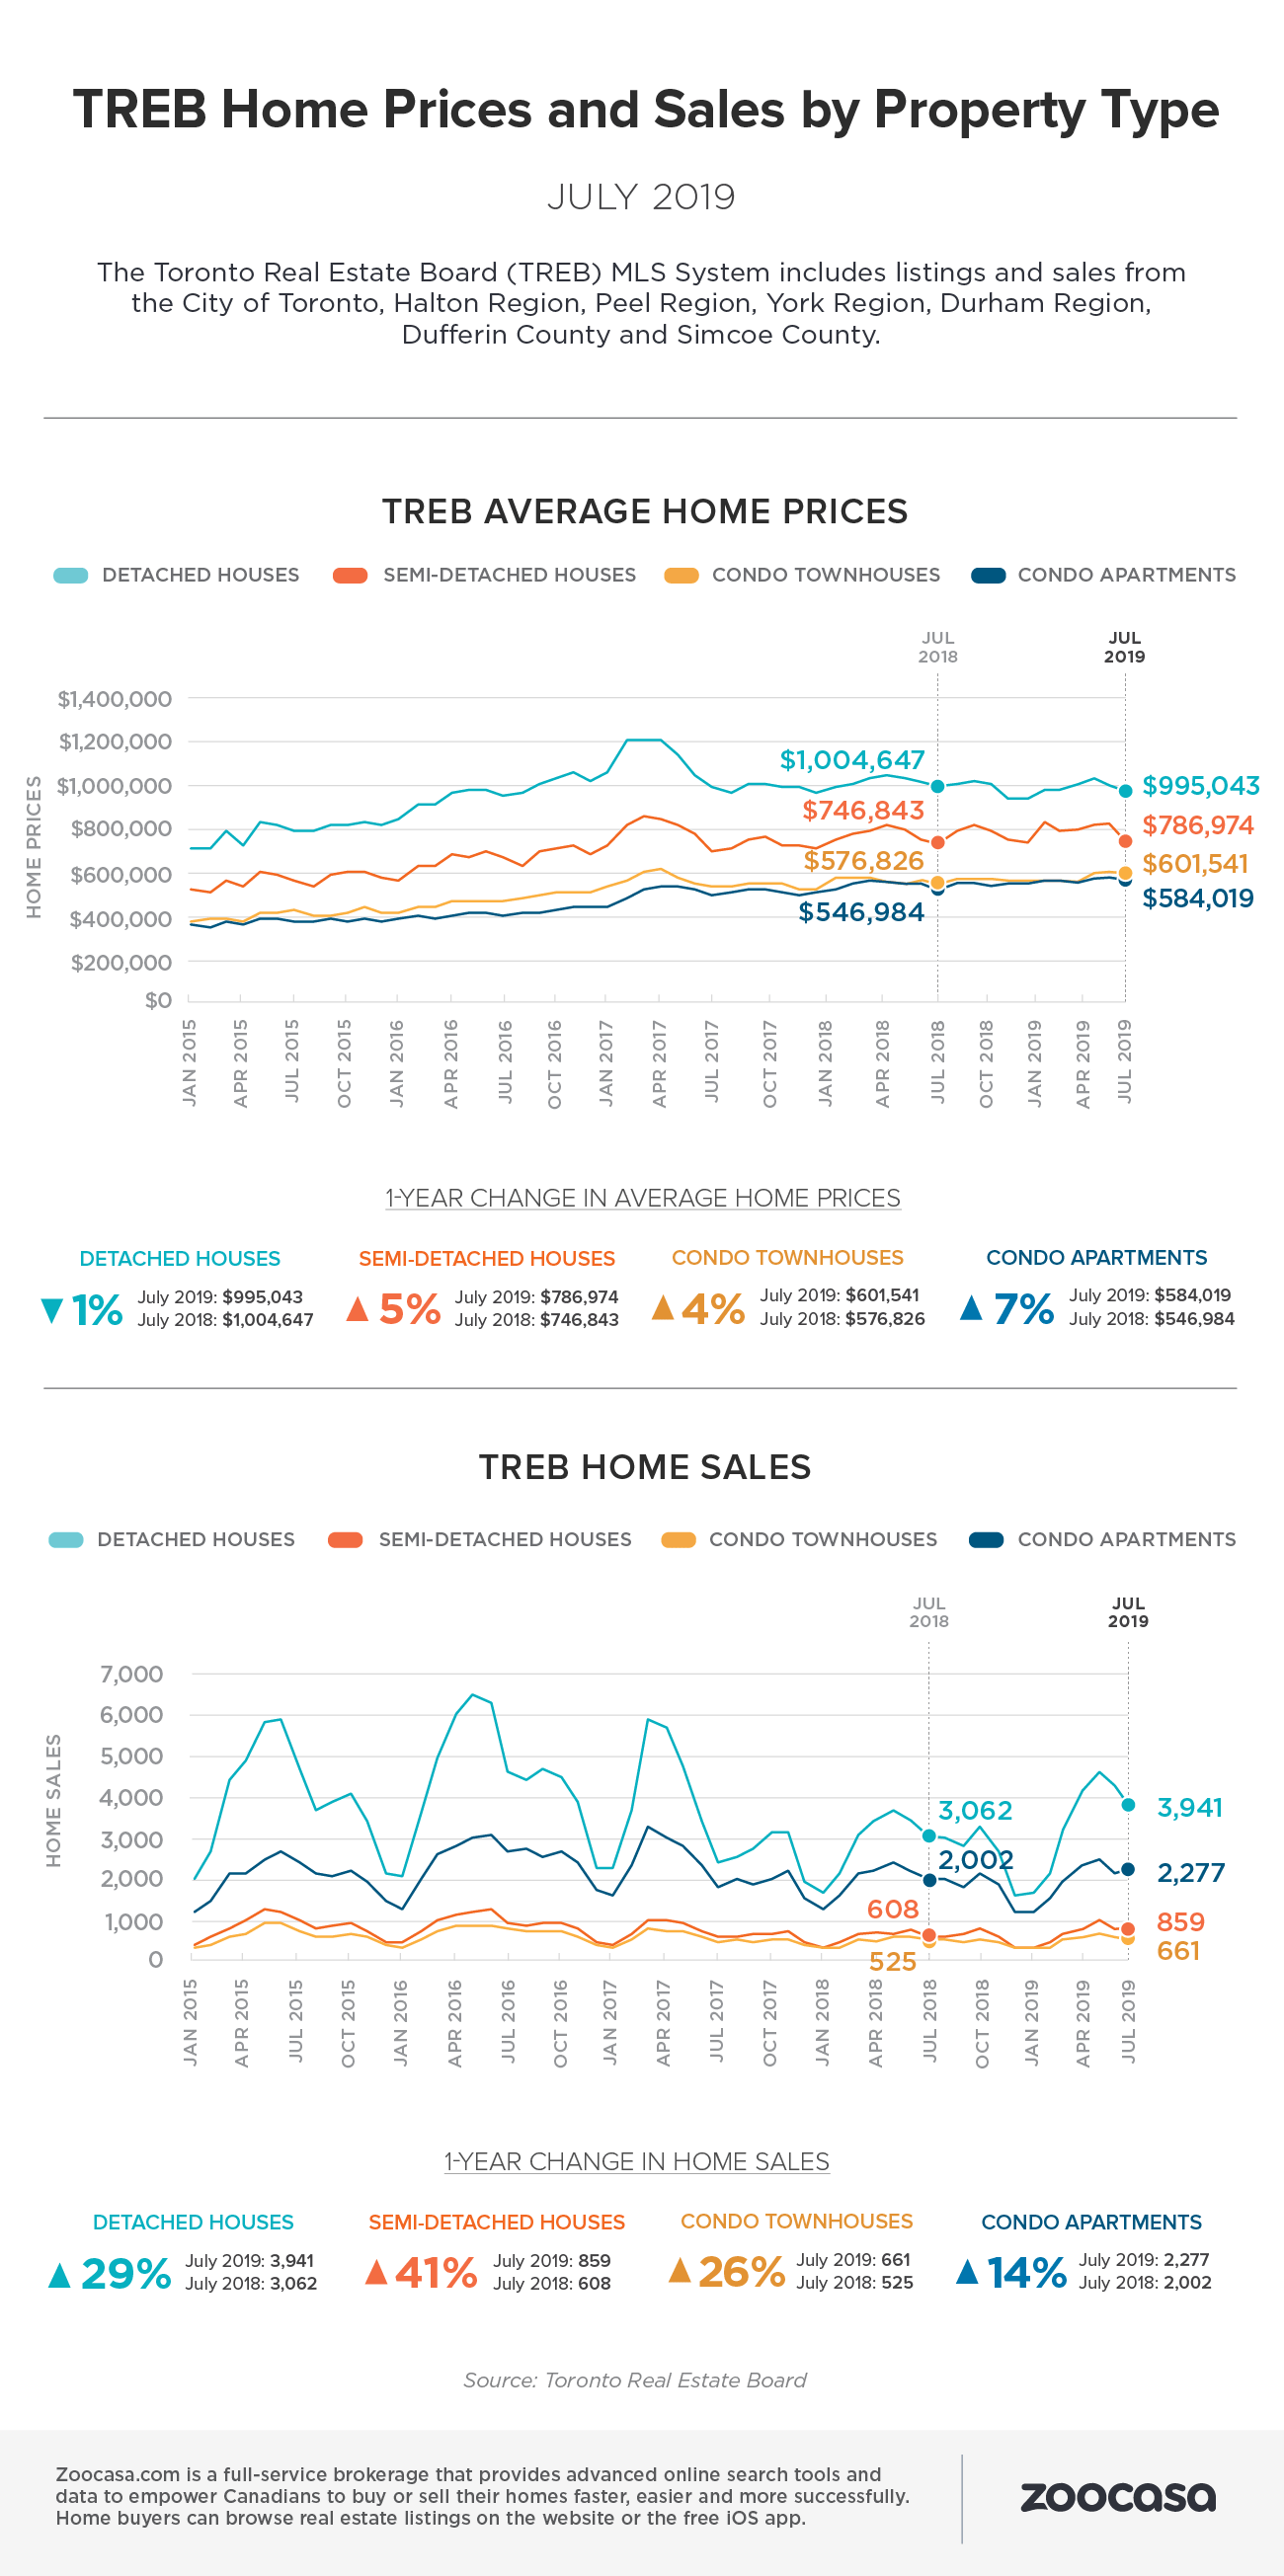
Condos, Townhouses, Semis See Greatest Price Growth
The MLS Home Price Index, which measures the overall value of homes sold, also rose 4.4% – however, TREB notes that the majority of price growth is happening in the multi-family segment, such as condos for sale in Toronto, while average sold house prices in Toronto remain relatively flat. This indicates that the demand is strongest for the most affordable home types.
“Broadly speaking, increased competition between buyers of available properties has resulted in relatively strong price growth above the rate of inflation for semi-detached houses, townhouses, and condominium apartments,” stated Jason Mercer, TREB’s chief market analyst.
“However, the single-detached market segment, which has arguably been impacted most by the OSFI stress test, has experienced a slower pace of price growth.”
Check out the infographics below to see how sales and price trends have changed year over year in both the City of Toronto and total TREB area in July: