Home price increases have been the norm in the past few years throughout North America. Since incomes have not kept pace with the brisk growth in real estate prices, the housing affordability issue has reached whole new levels in Canada, the U.S., as well as in Mexico.
The researchers at Point2 Homes have just released a study showcasing how real estate prices have changed in the last five years in North America’s 83 largest cities. Toronto stands out in the report with one of the biggest surges on the continent.
Toronto Homes, 59% Pricier than 5 Years Ago
Back in 2013, Toronto homes for sale would go for an average of $532,900. Fast forward five years, and they’ve increased to $845,000, making homeownership virtually unattainable for many home seekers.
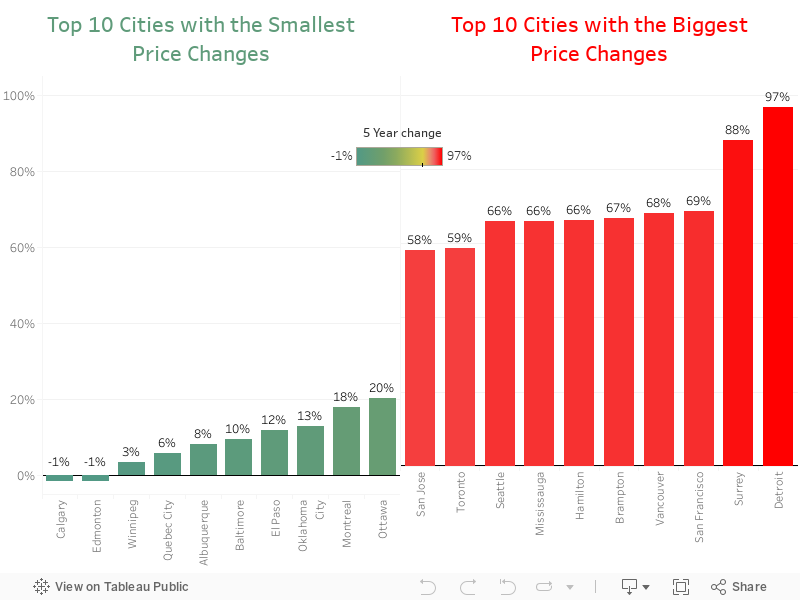
This difference translates into a 59% boost in home prices ,placing the city in the 9thposition when it comes to outrageous percentage changes in North America, right after five Canadian urban centers and three U.S. ones.
The Canadian cities that outranked Toronto are:
- Surrey, BC (the biggest price jump in the country, 88%)
- Vancouver, BC (68%)
- Brampton, ON (67%)
- Hamilton, ON and Mississauga, ON (both at 66%).
Their American counterparts are:
- Detroit, MI (highlighting a shocking 97% hike)
- San Francisco, CA (69%)
- Seattle, WA (66%)
To make better sense of the dramatic real estate scenario at hand, note that out of the 83 North American cities included in the analysis, 18 experienced dizzying price changes of over 50%. 11of them are in the U.S., six are in Canada, andone is in Mexico.
In contrast, only two markets saw actual price drops in 2018 compared to five years ago, and both are in Alberta. The fall in oil prices since 2014 can be linked to a 1% reduction in property prices in Calgary and Edmonton.
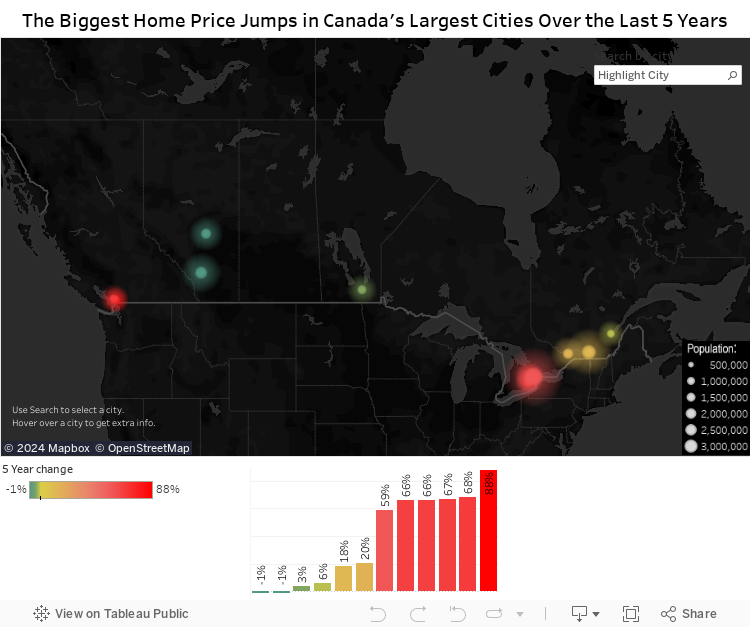
For a quick snapshot of the urban centres that saw the highest as well as the lowest price changes in the last five years on the continent, check out the interactive chart below:
3rd in Terms of Net Worth Jumps
Aside from percentage changes, the Point2 Homes researchers also looked at the net worth increases in North America’s largest cities. The surges recorded confirm once more that attaining the homeowner status has become increasingly difficult throughout time.
From 2013 to 2018, the city of Toronto showed a significant $312,100 boost in home prices, a discouraging number, since in some markets one can buy a property with this sum alone. Based on gains in net amounts, Toronto ranks 3rdin Canada, right after Vancouver, which boasted a $417,913 net jump, and Surrey, with an increase of $395,287.
Check out the map below to see all the Canadian cities included in the study. Be sure to zoom in and hover over the different locations for detailed info on each: