In the past five years, the U.S. housing market has undergone volatile changes thanks to the unpredictability of the pandemic, rising inflation, and supply challenges. In October 2018, the overnight federal funds rate was at 2.19% – at the time a 10-year high – but that rate has now skyrocketed to 5.33%. Many homebuyers feel the effects of the Federal Reserve’s multiple interest rate hikes and are looking to the rental market as an alternative option.
But is renting really more affordable than homeownership? To find out how much real estate prices have grown since 2018 compared to rental prices, Zoocasa analyzed median home price and rental data in 15 cities across the U.S. and compared the percentage differences.
Enjoying our content? Subscribe to our free weekly newsletter to get real estate market insights, news, and reports straight to your inbox.
Median home prices for 2018 to 2023 were sourced from individual real estate boards, such as Greater Nashville REALTORS®, Florida REALTORS®, and Greater Boston Association of REALTORS®. Median 1-bedroom rental data was sourced from Zumper.com, and in the case that October 2021 rental data could not be sourced, Dec 2021 data was used. National median 1-bedroom rent prices were sourced from both Zumper.com and Rent.com. The national median home price was sourced from the U.S. Census Bureau and U.S. Department of Housing and Urban Development, retrieved from FRED, Federal Reserve Bank of St. Louis and uses Q3 data for each year.

National Rent Growth Catching Up to Home Prices
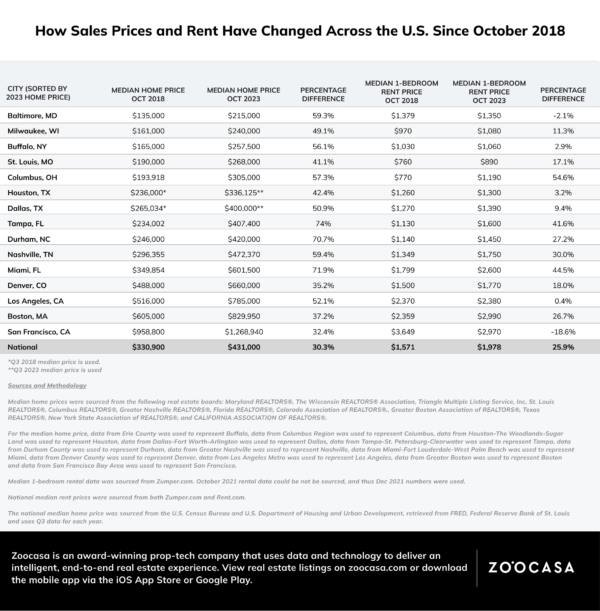
Nationally and locally, both rent and home prices have accelerated over the past five years, with the exception of San Francisco and Baltimore, but in every market analyzed median home price growth outpaces median 1-bedroom rent price growth. Every market experienced median home price growth of more than 30%, while rent growth was more varied.
In some markets, the difference is less apparent, with rent growth increasing at a comparable rate to home prices. The national median home price in Q3 2018 was $330,900 and in Q3 2023 the median price rose by 30.3% to $431,000. National rent is not far behind, increasing by 25.9% from 2018 to a median price of $1,978 in 2023.
Columbus, OH had the smallest difference in price growth between rental and resale markets, with rents increasing by 54.6%, the largest increase of all analyzed rental markets, and home prices increasing by 57.3%. Boston, MA followed with the median home price rising from $605,000 in 2018 to $829,950 in 2023, an increase of 37.2%, while median 1-bedroom rent in the city rose from $2,359 in 2018 to $2,990 in 2023, an increase of $26.7%.
Of the cities we analyzed, Boston had the most expensive rental prices and the second-most expensive home prices, just behind San Francisco, CA with a median home price of $1,268,940 in 2023. Despite having the second-most expensive rent, San Francisco is the only city besides Baltimore where rent decelerated, dropping from $3,649 in 2018 to $2,970 in 2023.
Two other cities besides Columbus, OH experienced both rent growth and home price growth of more than 40%: Miami, FL and Tampa, FL. Miami experienced the greatest increase in home prices, up by 71.9% in 5 years, and the second-greatest increase in rent at 44.5%. Miami is one of the hottest markets in the U.S., so homebuyers and renters keen on living in Florida should look to Tampa to save on housing expenses as the median home price is a third of that in Miami.

Prices Cooling Off in These Markets
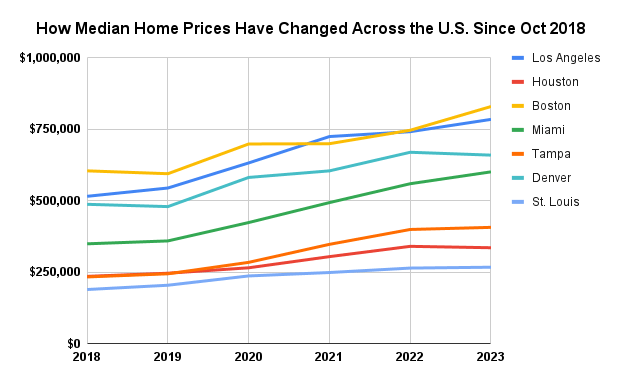
Prices in both the rental and resale segments are starting to come down from pandemic highs, giving buyers an opportunity to jump into previously out-of-reach markets. From 2022 to 2023, Houston, TX, Denver, CO, and Nashville, TN experienced a drop in median home prices, with Denver experiencing the largest year-over-year decrease of $10,000. Denver also experienced the second-smallest increase in price from 2018 to 2023 at 35.2%.
Eight markets experienced a drop in the median rent price from 2022 to 2023, including Los Angeles, CA, Dallas, TX, Boston, and Tampa. Rent in Los Angeles, Buffalo, NY, and Houston has hardly changed from five years ago, increasing by just 0.4%, 2.9% and 3.2% respectively. Home prices in Buffalo are also more affordable than other markets, and nearly half of the national median, resulting in less demand for rent compared to markets where homebuyers are priced out.
If you’re considering buying or selling and want to learn more about prices and sales activity in your local market, our qualified agents are here to help you! Give us a call today to learn more.
Methodology
Median home prices were sourced from the following real estate boards: Maryland REALTORS®, The Wisconsin REALTORS® Association, Triangle Multiple Listing Service, Inc, St. Louis REALTORS®, Columbus REALTORS®, Greater Nashville REALTORS®, Florida REALTORS®, Colorado Association of REALTORS®., Greater Boston Association of REALTORS®, Texas REALTORS®, New York State Association of REALTORS®, and CALIFORNIA ASSOCIATION OF REALTORS®.
For the median home price, data from Erie County was used to represent Buffalo, data from Columbus Region was used to represent Columbus, data from Houston-The Woodlands-Sugar Land was used to represent Houston, data from Dallas-Fort Worth-Arlington was used to represent Dallas, data from Tampa-St. Petersburg-Clearwater was used to represent Tampa, data from Durham County was used to represent Durham, data from Greater Nashville was used to represent Nashville, data from Miami-Fort Lauderdale-West Palm Beach was used to represent Miami, data from Denver County was used to represent Denver, data from Los Angeles Metro was used to represent Los Angeles, data from Greater Boston was used to represent Boston and data from San Francisco Bay Area was used to represent San Francisco.
Median 1-bedroom rental data was sourced from Zumper.com. October 2021 rental data could be not be sourced, and thus Dec 2021 numbers were used.
National median rent prices were sourced from both Zumper.com and Rent.com.
The national median home price was sourced from the U.S. Census Bureau and U.S. Department of Housing and Urban Development, retrieved from FRED, Federal Reserve Bank of St. Louis and uses Q3 data for each year.