A decade has passed since the collapse of Lehman Brothers, the largest bankruptcy case in history, which fueled the global financial crisis of 2008. The US real estate market took a direct hit, while the Canadian economy went through its own state of turmoil a few years later.
But just how much was housing in Canada and the U.S. affected by the crisis and what does this mean for the average Canadian and American today?
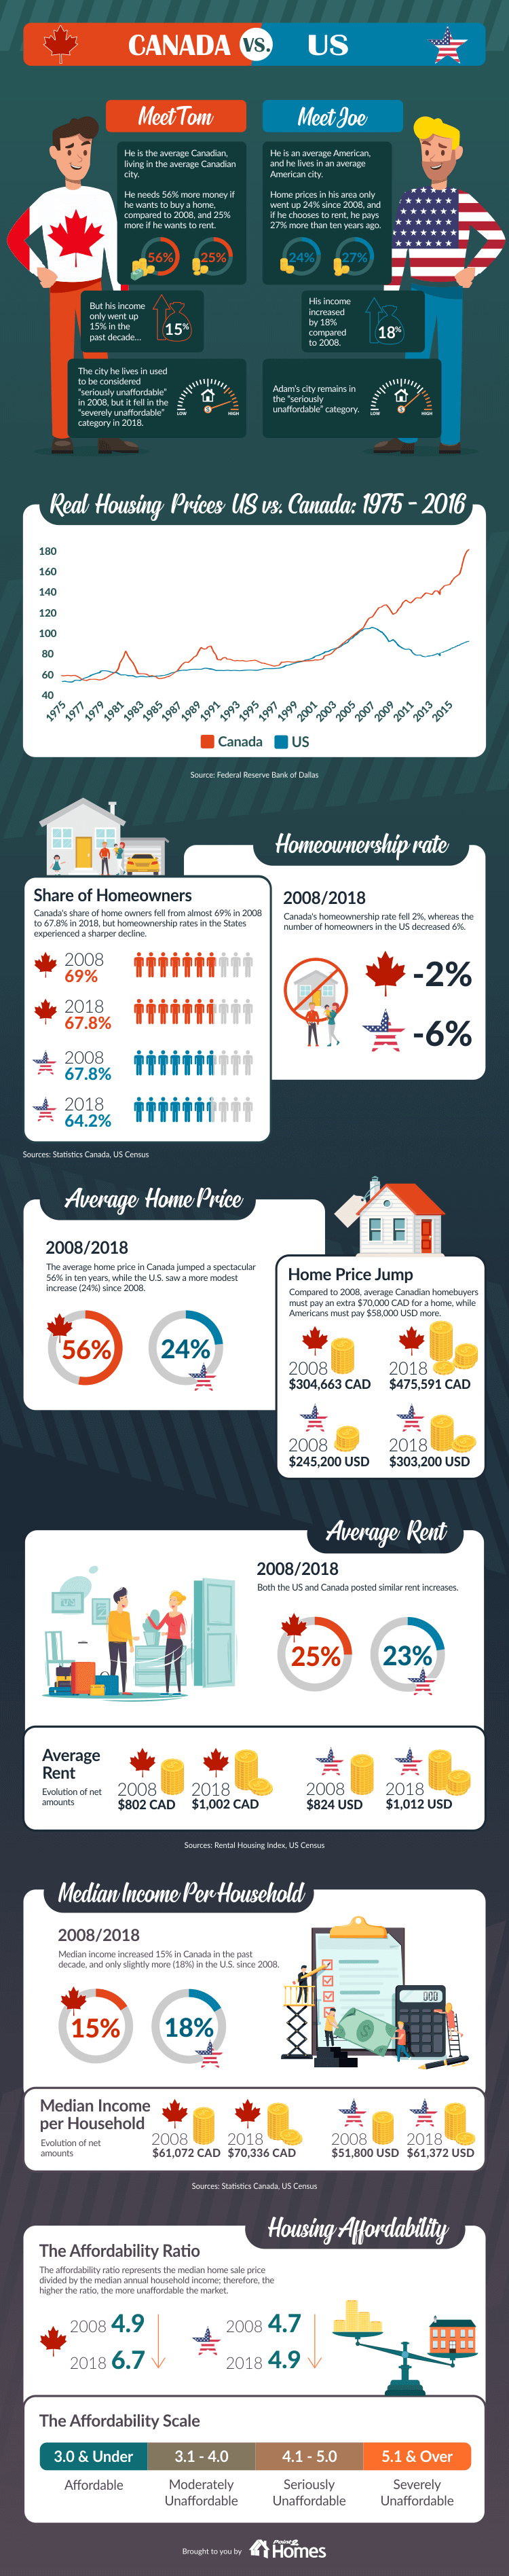
Point2 Homes investigated how the two real estate markets have changed these past 10 years.Their researchers examined housing stats from 2008 and 2018 and put together a side-by-side comparison to determine which country has it worse. The key metrics that were taken into account are average home prices, rents, homeownership rates and median incomes, as well as each country’s evolution on the affordability scale.
More Expensive Housing, Less Income
In both Canada and the U.S., increases in incomes did not keep up with gains in real estate prices. Moreover, price tags on Canadian homes rose twice as fast as the ones on American properties.
Canada saw only a 15% boost in net earnings in the last 10 years, from $61,072 CAD to $70,336 CAD, while average home prices here experienced awhopping 56% surgein the same time frame (from $304,663 CAD to $475,591 CAD). As one might expect, the Vancouver and Toronto real estate markets were mostly responsible for this overall increase.
Rent hikes, on the other hand, were a bit tamer, jumping only 25%to $1,002 CAD in 2018 from $802 CAD in 2008. Vancouver and Toronto rentals continue to stand out as the most expensive in the country.
For US residents, changes in earnings and real estate price tags did not differ to such a big extent, though they were not exactly in favour of home seekers either. Property prices increased 24%,from $245,200 USD to $303,200 USD in the last decade, while the median income per US household showed a lower gain of 18%(from $51,800 USD to $61,372 USD). Rents went up by 23%for Americans.
Drop in Affordability and Homeownership Rates
Housing affordability grew worse in both countries, with Canada being at a clear disadvantage compared to the U.S. Even so, overall homeownership rates remained higher north of the border.
After increasing consistently throughout the years and reaching a record high in 2011 (69%), the Canadian homeownership rate declined for the very first time in almost half a century, to 67.8% in 2018.
Affordability also deteriorated, with research indicating that it’s actually at its worst since 1990. Canada’s affordability ratio (meaning the median home sales price divided by the median annual household income) was at 4.9 back in 2008, placing the country in the “seriously unaffordable”category. If that wasn’t bad enough, 10 years later the ratio reached a figure of 6.7, propelling Canada into a whole new league, that of “severely unaffordable.”
The U.S., on the other hand, remained pegged at “seriously unaffordable,”experiencing only a slight uptick in its affordability ratio, from 4.7 in 2008 to 4.9 in 2018. The share of American homeowners sat at 67.8% in 2008, only to reach its lowest level in 2015 (62.9%) and then to slowly start gaining momentum and arrive at 64.2% in 2018.
Point2 Homes put together a comprehensive infographic to better illustrate all of these differences between the Canadian and the US housing markets between 2008 and 2018. Check it out below: