The Canadian Real Estate Association (CREA) monthly report for May released earlier this week revealed that national home sales dropped 40% year-over-year (y-o-y), and new listings declined at a similar rate (38%) annually. These findings are likely unsurprising to those following the Canadian housing market closely over the past few months; despite strong market activity earlier in the year, COVID-19 put a damper on sales and listing activity after various public health and safety measures were implemented across the country in March. In reaction to these measures, a number of home buyers and sellers opted to remain on the sidelines until they felt more confident about how the pandemic would impact their home search or sale.
To assess the current dynamic between demand and supply in markets across Canada, Zoocasa used official monthly data from CREA to review how sales declines compared to declines in new listings by calculating the sales-to-new-listings ratio (SNLR) for 20 major real estate markets across the country.
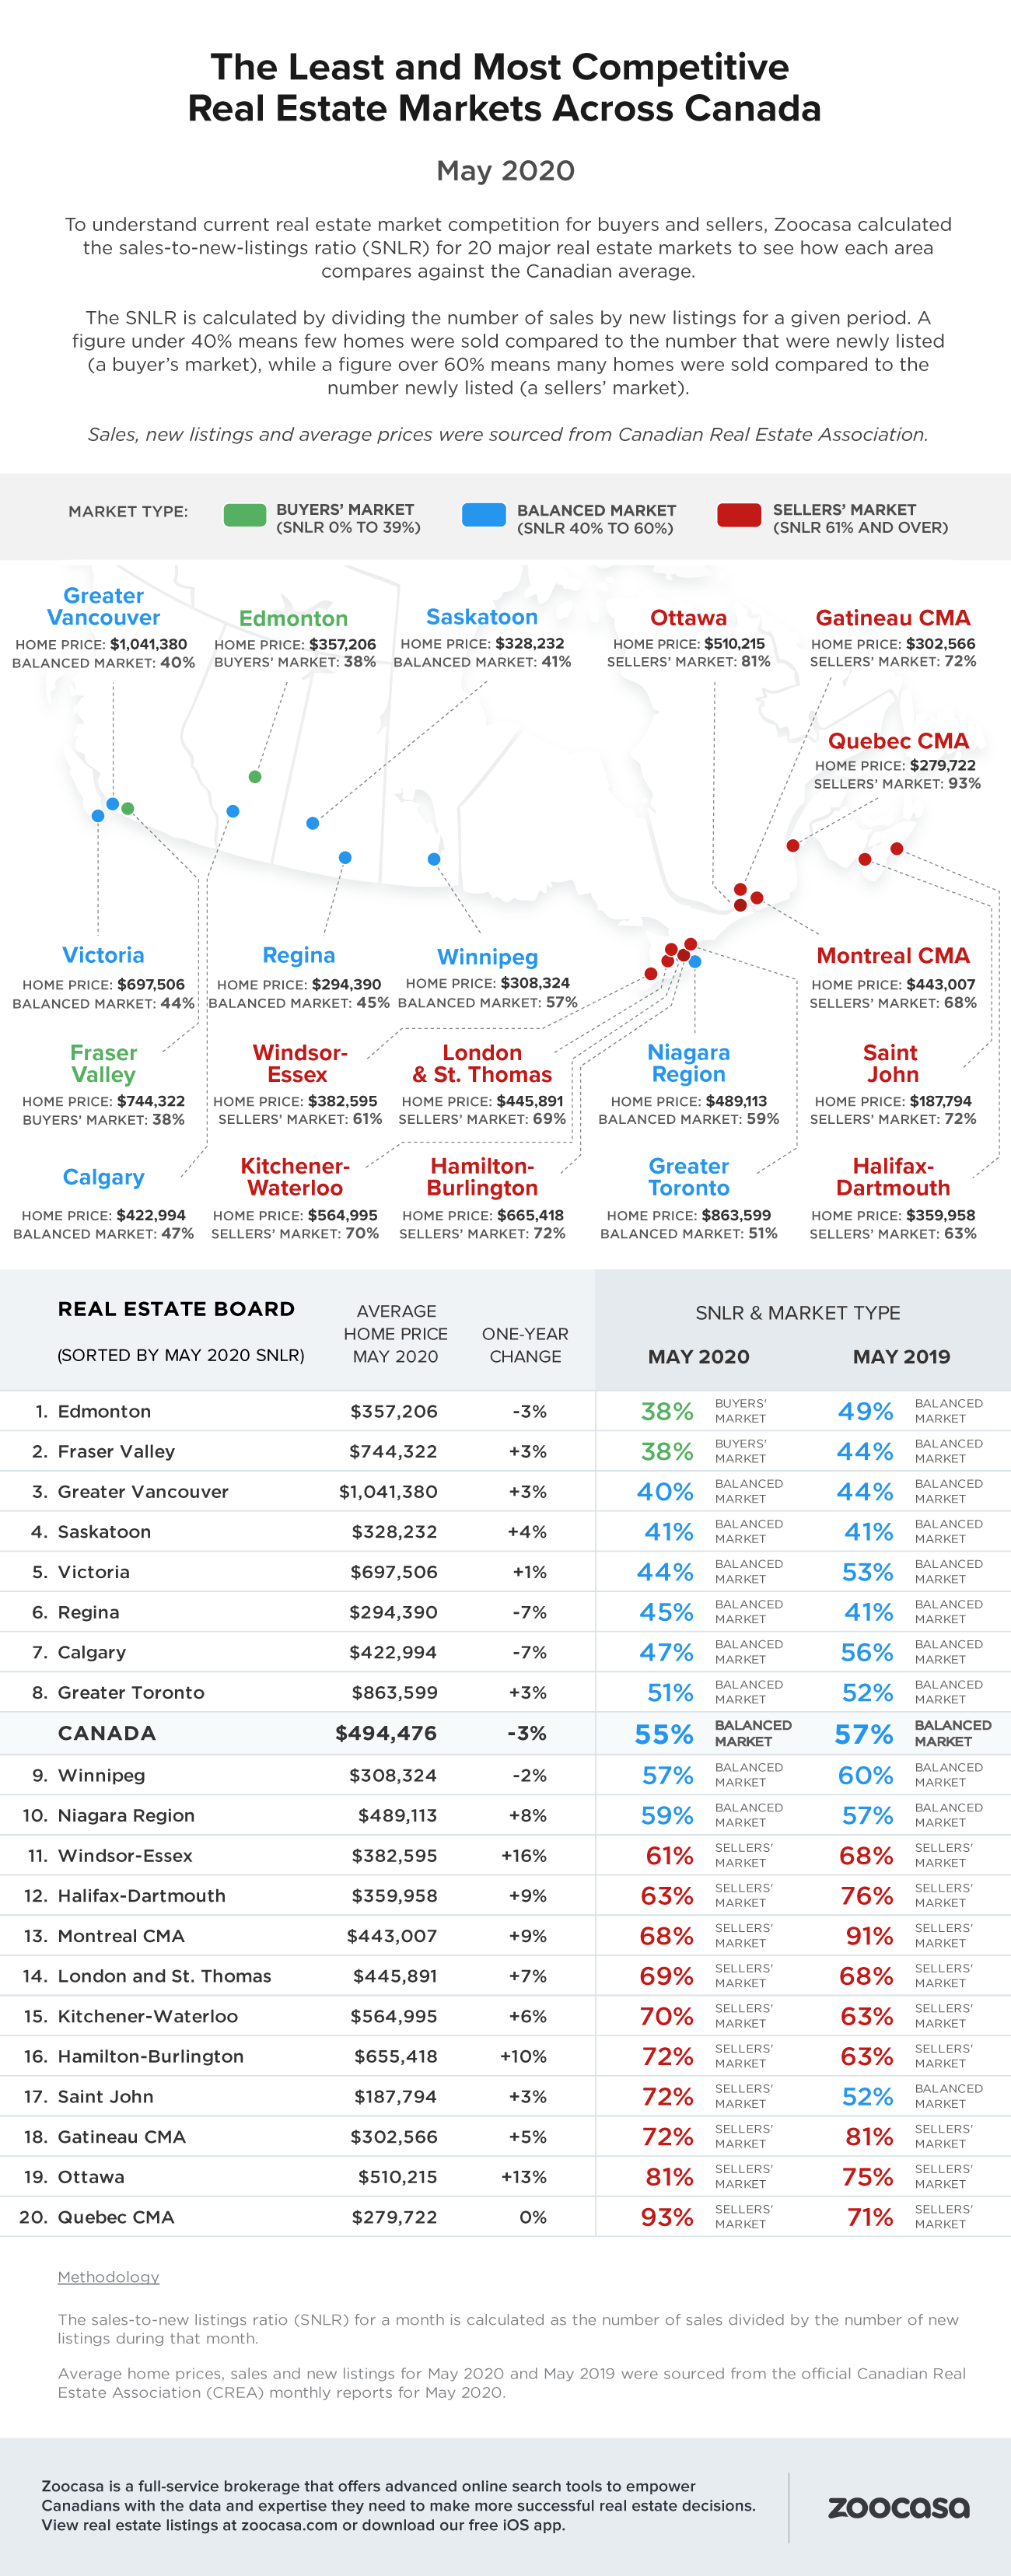
The SNLR is calculated by dividing the number of sales by the number of new listings for a given period. A figure under 40% means few homes sold compared to the number that were listed during that period (a buyer’s market), while a figure over 60% means many homes were sold compared to the number listed during that time (a sellers’ market). A figure between 40% and 60% indicates that demand and supply was balanced during the period covered.
As COVID-19 restrictions ease in some regions and market activity slowly ramps up, it may be helpful for buyers and to get a read on how competitive housing activity is in their area. For instance, in regions where sales and new listings declined at a similar pace, buyers may find that despite substantially lower sales and inventory, the housing market may feel just as competitive as last year. In regions where sales or new listings declined at different rates, conditions may have shifted from last year that now favour buyers over sellers or vice versa.
Our analysis provides a snapshot of market dynamics and competition at the regional level to give buyers and sellers a better indication of the markets in which they may have some leverage. That being said, real estate is local, and prospective home buyers and sellers will benefit from seeking a more detailed analysis of sales, new listings, and price trends for specific home types of interest at the city, town, or neighbourhood level.
Lower Sales But Fewer Listings Means Buyers Face Just as Much Competition as 2019
As CREA noted in their release for May, measures of market balance were “remarkably little changed considering the extent to which current economic and social conditions are impacting both buyers and sellers.”
Specifically, 33,051 homes sold across Canada in May 2020, and 59,977 homes were newly listed for sale. This resulted in an SNLR of 55%, meaning the national housing market remained in balanced territory for the second month in a row.
In May 2019, there were 54,874 sales and 96,830 new listings across Canada and the SNLR for the national housing market was 57%. As such, although there were 40% fewer home sales and 38% fewer new listings in May this year, with sales and new listings supply moving in tandem, buyers and sellers experienced similar levels of competition this year. The average home price in Canada for May was $494,476, representing a slight 3% dip but was relatively unchanged from last year.
This similarity of market conditions to last year may be disappointing for aspiring buyers who may have hoped to gain some leverage in a less competitive market. However, stability in market conditions is potentially positive news for property owners who need to list their home during this period.
Canada’s Two Largest Markets, Toronto and Vancouver, Exhibit Balanced Conditions
Both of Canada’s largest housing markets – Greater Vancouver and Greater Toronto – exhibited balanced market conditions during May. In Greater Toronto, home sales dropped a whopping 54% y-o-y to 4,606, and new listings declined 53% with 9,104 homes being listed. Given the near-identical rate of decline in sales and new listings, buyers and sellers that were active in the market during May experienced similar levels of competition as those last year. This is evidenced by the SNLR for Greater Toronto in May 2020 being 51% compared to an SNLR of 52% in May last year.
In May 2019, Greater Vancouver market activity was on the lower-end of the range for balanced market conditions with an SNLR of 44%. With sales declining 44% y-o-y to 1,506 and new listings dropping 37% y-o-y to 3,784 in May 2020, market conditions edged slightly closer to buyer’s market territory, but remained within the realm of balanced conditions with an SNLR of 40%.
In a divergence from the national trend, average home prices rose in both markets on an annual basis. In both, the average home price increased 3% to $1,041,380 in Greater Vancouver, and $863,599 in Greater Toronto.
Edmonton and Fraser Valley are the Only Markets Favouring Home Buyers
Of the 20 markets studied, 8 markets exhibited an SNLR lower than the national average, meaning competition conditions in these markets slightly favoured home buyers compared to the national average.
However, of these 8 markets just two markets could be categorized as buyer’s markets, while the rest remain in balanced market territory. In Edmonton, sales dropped 40% y-o-y to 1,320 and new listings declined 21% to 3,514, resulting in an SNLR of 38%. This figure represents a departure from conditions last May, when the Edmonton housing market was comfortably balanced with an SNLR of 49%.
Similarly, the SNLR in Fraser Valley dropped from 44% last year to 38% this year, signifying a similar shift from balanced to buyer’s market conditions in that region. Compared to Edmonton, there was a steeper 47% drop in sales, with just 766 homes changing hands in Fraser Valley during May 2020, and a 37% decline in new listings to 2,034.
While sales and new listings followed a similar trajectory, Edmonton mirrored national price trends with a 3% y-o-y decline in the average home price to $357,206 while in Fraser Valley, the average home price rose 3% to $744,322.
10 Regional Markets Exhibit Competition Conditions Favouring Sellers
Of the 20 markets studied, exactly half exhibited competition conditions in May 2020 explicitly favouring sellers. Of these, Quebec CMA represented the market that most heavily favoured sellers with an SNLR of 93%. Although the average home price remained flat y-o-y, and sales declined a modest 7%, more sellers chose to remain on the sidelines with 29% fewer homes being listed in the area this May compared to last year.
Ottawa ranked second in terms of markets where home buyers faced the most competition. Although sales were down 44%, new listings declined slightly more, by 49% y-o-y. This resulted in an SNLR of 81% in May 2020 versus an SNLR of 75% during the same period last year, meaning buyers faced even more competition in the market this year than those who were active in 2019. The strong competition between buyers is reflected in the 13% annual increase in the average price in the area to $510,215.
Here’s a snapshot of annual average price changes and market competition conditions for buyers and sellers across 20 regional markets across Canada in May 2020.
5 Markets Most Favourable for Buyers
1. Edmonton
- Average home price, May 2020: $357,206 (-3% from 2019)
- SNLR, May 2020: 38% (Buyers’ market)
- Home sales, May 2020: 1,320 (-40% from 2019)
- New listings, May 2020: 3,514 (-21% from 2019)
2. Fraser Valley
- Average home price, May 2020: $744,322 (+3% from 2019)
- SNLR: 38% (Buyers’ market)
- Home sales, May 2020: 766 (-47% from 2019)
- New listings, May 2020: 2,034 (-3% from 2019)
3. Greater Vancouver
- Average home price, May 2020: $1,041,380 (+3% from 2019)
- SNLR: 40% (Balanced market)
- Home sales, May 2020: 1,506 (-44% from 2019)
- New listings, May 2020: 3,784 (-37% from 2019)
4. Saskatoon
- Average home price, May 2020: $328,232 (+4% from 2019)
- SNLR: 41% (Balanced market)
- Home sales, May 2020: 470 (-15% from 2019)
- New listings, May 2020: 1,155 (-14% from 2019)
5. Victoria
- Average home price, May 2020: $697,506 (+1% from 2019)
- SNLR: 44% (Balanced market)
- Home sales, May 2020: 436 (-46% from 2019)
- New listings, May 2020: 996 (-34% from 2019)
5 Markets Most Favourable to Sellers
1. Quebec City CMA
- Average home price, May 2020: $279,722 (no change from 2019)
- SNLR: 93% (Sellers’ market)
- Home sales, May 2020: 804 (-7% from 2019)
- New listings, May 2020: 868 (-29% from 2019)
2. Ottawa
- Average home price, May 2020: $510,215 (+13% from 2019)
- SNLR: 81% (Sellers’ market)
- Home sales, May 2020: 1,364 (-44% from 2019)
- New listings, May 2020: 1,681 (-49% from 2019)
3. Gatineau CMA
- Average home price, May 2020: $302,566 (+5% from 2019)
- SNLR: 72% (Sellers’ market)
- Home sales, May 2020: 411 (-36% from 2019)
- New listings, May 2020: 567 (-29% from 2019)
4. Saint John
- Average home price, May 2020: $187,794 (+3% from 2019)
- SNLR: 72% (Sellers’ market)
- Home sales, May 2020: 194 (-18% from 2019)
- New listings, May 2020: 270 (-41% from 2019)
5. Hamilton-Burlington
- Average home price, May 2020: $655,418 (+10% from 2019)
- SNLR: 72% (Sellers’ market)
- Home sales, May 2020: 852 (-42% from 2019)
- New listings, May 2020: 1,188 (-49% from 2019)
Table of the Most and Least Competitive Canadian Real Estate Markets in May 2020
| Rank | City | Average Home Price (May 2020) | One-Year Home Price Change (%) | Sales-to-Listings Ratio (May 2020) | Sales-to-Listings Ratio (May 2019) |
|---|---|---|---|---|---|
| 1 | Edmonton | $357,206 | -3% | 38% | 49% |
| 2 | Fraser Valley | $744,322 | 3% | 38% | 44% |
| 3 | Greater Vancouver | $1,041,380 | 3% | 40% | 44% |
| 4 | Saskatoon | $328,232 | 4% | 41% | 41% |
| 5 | Victoria | $697,506 | 1% | 44% | 53% |
| 6 | Regina | $294,390 | -7% | 45% | 41% |
| 7 | Calgary | $422,994 | -7% | 47% | 56% |
| 8 | Greater Toronto | $863,599 | 3% | 51% | 52% |
| 9 | Winnipeg | $308,324 | -2% | 57% | 60% |
| 10 | Niagara Region | $489,113 | 8% | 59% | 57% |
| 11 | Windsor-Essex | $382,595 | 16% | 61% | 68% |
| 12 | Halifax-Dartmouth | $359,958 | 9% | 63% | 76% |
| 13 | Montreal CMA | $443,007 | 9% | 68% | 91% |
| 14 | London and St. Thomas | $445,891 | 7% | 69% | 68% |
| 15 | Kitchener-Waterloo | $564,995 | 6% | 70% | 63% |
| 16 | Hamilton-Burlington | $655,418 | 10% | 72% | 63% |
| 17 | Saint John | $187,794 | 3% | 72% | 52% |
| 18 | Gatineau CMA | $302,566 | 5% | 72% | 81% |
| 19 | Ottawa | $510,215 | 13% | 81% | 75% |
| 20 | Quebec CMA | $279,722 | 0% | 93% | 71% |
Methodology
The sales-to-new listings ratio (SNLR) for a month is calculated as the number of sales divided by the number of new listings during that month.
Average home prices, sales and new listings for May 2020 and May 2019 were sourced from the official Canadian Real Estate Association (CREA) monthly report for May 2020.
Contact
For more information about this report or to set up a media interview, please contact [email protected]