
Housing competition heated up this fall across major Ontario markets despite new pandemic restrictions being rolled out by the Ontario government to slow the spread of COVID-19. There was an annual uptick in home sales across the province with several real estate boards including the Toronto Regional Real Estate Board (TRREB) reporting a record-breaking month of sales in October.
As 2020 comes to a close, Zoocasa took a closer look at housing competition across 35 Ontario real estate markets by reviewing sales and new listings data for each region for the month of October. Zoocasa used this data to determine the sales-to-new-listings ratio (SNLR) for the month – SNLR is calculated by dividing the total number of sales by the number of new listings in a particular region at a point in time. The SNLR is used to illustrate demand and supply dynamics in a given area, and can help identify the degree of competition faced by local buyers in relation to supply. As such:
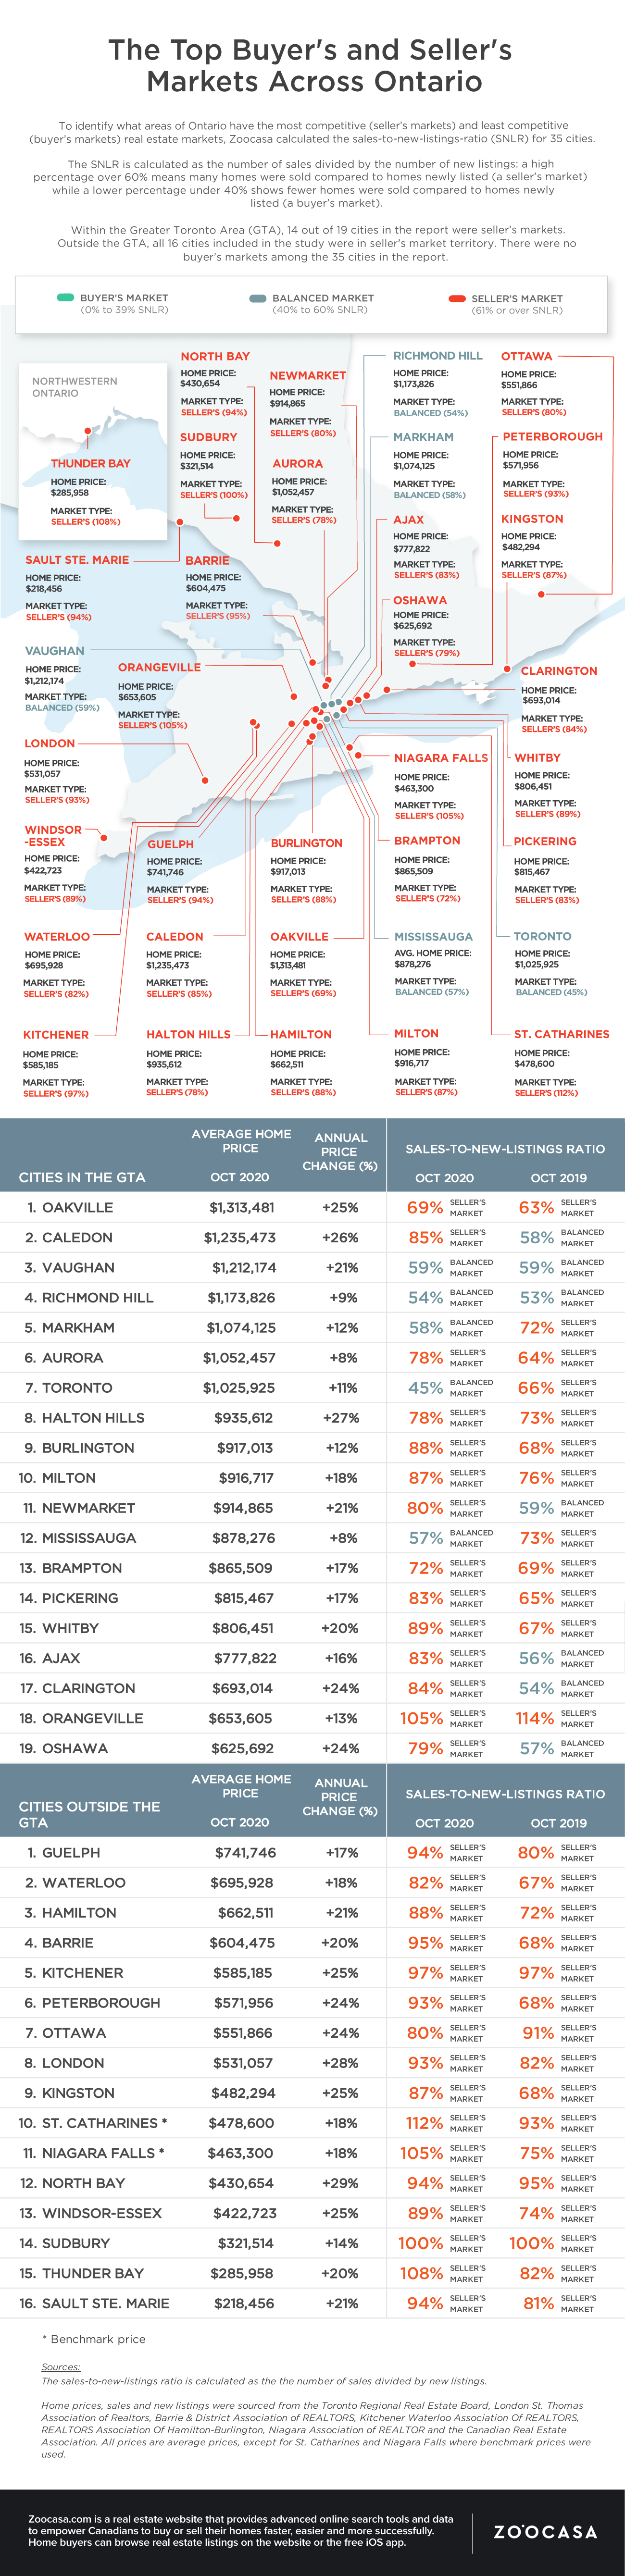
- An SNLR under 40% depicts a buyer’s market: where new listings outstrip sales, and buyers have greater choice
- An SNLR between 40% and 60% depicts a balanced market: where, as the name suggests, demand and supply are in balance
- AN SNLR over 60% depicts a seller’s market: where sellers may have the upper hand as demand outpaces supply
Our findings show that 30 of the 35 markets included in our analysis exhibit strong sellers’ market conditions, where high demand and a low number of new listings meant that buyers faced strong competition for listings. This is up from 27 markets that exhibited sellers’ market conditions in October 2019. The remaining markets all exhibited balanced market conditions, and notably, each of these balanced markets is located within the GTA.
14 of 19 GTA Housing Markets Strongly Favour Sellers; City of Toronto Among 5 Markets Exhibiting Balanced Competition Conditions
With 3,514 sales and 7,823 new listings in October, the City of Toronto is among 5 housing markets exhibiting balanced market conditions in Ontario in October, with an SNLR of 45% – showing that housing competition has cooled since October 2019, when the SNLR was 66% and favoured sellers. That being said, it’s important to keep in mind that these figures are influenced by condo market activity where sales have declined amidst the pandemic while new listings increased by more than double (109%) year-over-year.
According to Evelyn Anders, a Zoocasa agent in Toronto, competition remains fierce for freehold homes in particular as inventory continues to be low. “Going into 2021, I expect more competition in the first quarter, as sellers that were able to wait on the sidelines or were undecided may begin to list their homes. Depending on its effectiveness, the COVID-19 vaccine is likely to have a ripple effect on housing market conditions, particularly in dense urban centers like Toronto, that may see demand re-emerge across all market segments” says Anders.
3 of the 5 Ontario markets exhibiting balanced conditions are in York Region: Richmond Hill (SNLR of 54%), Vaughan (SNLR of 59%) and Markham (SNLR of 58%). While these conditions are similar to what buyers faced in 2019 in Richmond Hill and Vaughan, competition has cooled slightly in Markham compared to last year, when the SNLR was 72%.
“Currently, buyers are most interested in freehold properties with backyards, and it is common to see multiple offers on such listings given limited inventory,” says Claudio Castro, a Zoocasa agent in the York Region. “Homes listed in the $1 million range are the most competitive, seeing that buyers are able to secure a 4 bedroom, detached property within the $1,100,000 – $1,400,000 range in York Region.” Castro notes that as long as COVID-19 remains a factor, we can expect this trend to continue into the new year.
The final market exhibiting balanced conditions is Mississauga, with 943 sales and 1,665 new listings and an SNLR of 57% in October. Similar to Toronto, Mississauga is a condo-dense market, and as such, a higher volume of listings and lower sales due to the pandemic has a role to play in the SNLR shift from last year, when Mississauga was in seller’s market territory with an SNLR of 73%.
Buyers Face Stiff Competition in All 16 Housing Markets Outside the GTA; 4 Markets With SNLR At or Over 100%
Just as in 2019, all 16 housing markets included in our analysis exhibited strong sellers’ market conditions in October, with an SNLR of 80% or more. Of these markets, 4 exhibited an SNLR of 100% or more, meaning that demand was much higher than new listings and buyers began to pick up inventory listed before October. These markets were: Sudbury (SNLR of 100%), Niagara Falls (105%), Thunder Bay (108%) and St. Catherines (112%). With the exception of Sudbury, buyers faced even stiffer competition this year than they did in 2019.
Elsewhere in Ontario, home buyers this year faced at minimum, similar levels of competition to those last year, with the majority of markets exhibiting an even higher SNLR this year compared to 2019. Ottawa is the only market where competition eased slightly for buyers this year, although the region remains in strong sellers’ market territory with 2,187 sales and 2,725 new listings and an SNLR of 80% compared to 91% last year.
According to Jonathan Amodeo, a Zoocasa broker in Ottawa, where buyers are looking for a property will likely have an impact on how competitive it might be. “Generally speaking, Ottawa and the surrounding areas to the East, West and South are all still experiencing record sale prices with most properties going in multiple offers over asking, with neighbourhoods in Ottawa’s newer suburbs and pockets of the urban core seeing the highest influx of demand” said Amodeo.
While there are several uncertainties with respect to COVID-19, based on today’s conditions, Amodeo expects the market to remain busy and competitive going into 2021, which may be a catalyst for further price increases. While more properties will come to market in 2021, it is likely that the buyer pool will continue to grow, fueled by out-of-town buyers transitioning to Ottawa and individuals who were not able to secure a property in 2020. In particular, the condo townhouse segment and more generally, homes listed under $400,000 are likely to remain popular.
Check out the infographic below to see which Ontario housing markets were most and least competitive in October, and how they compared to the same time period in 2019.
Methodology
The sales-to-new-listings ratio is calculated as the number of sales divided by new listings.
Home prices, sales and new listings were sourced from the Toronto Regional Real Estate Board, London St. Thomas Association of Realtors, Barrie & District Association of REALTORS, Kitchener Waterloo Association Of REALTORS, REALTORS Association Of Hamilton-Burlington, Niagara Association of REALTOR and the Canadian Real Estate Association. All prices are average prices, except for St. Catharines and Niagara Falls where benchmark prices were used.
For more information about this report or to set up a media interview, please contact [email protected]