It is undeniable that Ontario’s Greater Golden Horseshoe – the region that encompasses the basin of Lake Ontario and is ridged by the Niagara escarpment – has experienced some of the province’s most feverish real estate growth.
Sales have exploded by 147% over the last 10 years in Hamilton, which has become an increasingly popular draw for home buyers, and by 31% in nearby Burlington. Surging demand in these cities is likely driven in part by their comparable affordability; despite home prices more than doubling over the past decade in each, the average hit $526,762 in Hamilton and $738,905 in Burlington in June – considerably lower than the average of $915,481 in the neighbouring City of Toronto.
However, while buyers may be able to buy a home for less in the GGH, they’re more likely to face steep competition to do so, as new data from Zoocasa reveals Hamilton and Burlington remain steeped in scorching sellers’ markets.
The study, which analyzed January – June 2019 year-to-date sales, new listings, and price data, finds that in Hamilton, only one of 27 neighbourhoods can be classified as a buyers’ market; nine remain balanced, while 17 have officially entered seller-friendly territory. It’s a similar landscape in Burlington, with only one of eight markets considered to be buyers’, three balanced, and four as sellers’ markets.
The assessment of local market conditions is based on their sales-to-new-listings ratio (SNLR), a metric that’s used to measure the level of competition within a housing market. Calculated by dividing the number of sales by the number of new listings brought to market between January – June 2019, a percentage between 40 – 60% indicates balanced conditions, while below and above that threshold reveal buyers’ and sellers’ markets, respectively.
Related Read: Buyers’ and Sellers’ Markets Across Canada in June
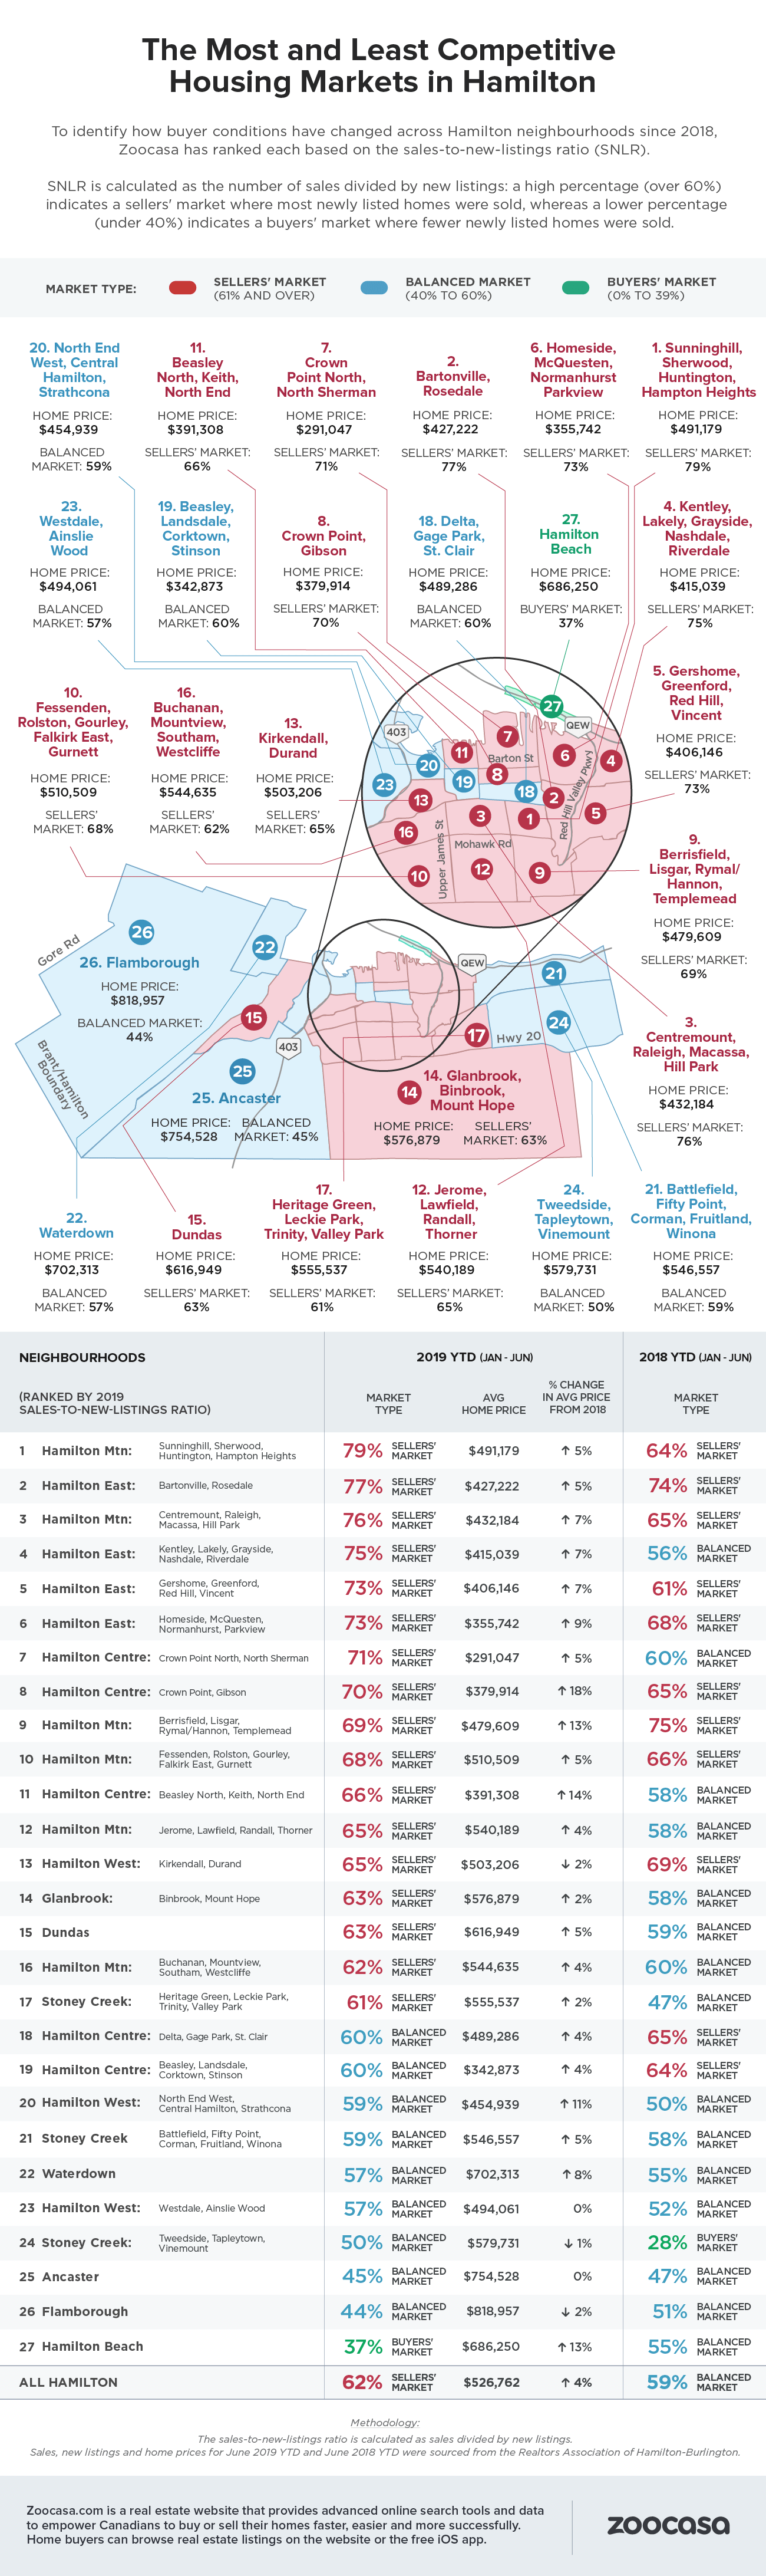
Hottest Hamilton Markets Located on Mountain
Hamilton real estate has been steadily heating, with the city as a whole hitting an SNLR of 62% in June, pushing it into a sellers’ market from 59% over the same time frame in 2018. That’s been made possible by an 11% spike in sales YTD, well outpacing a 4.7% uptick in new supply.
The city’s hottest neighbourhoods can be found on the Mountain, in the municipality that includes Sunninghill, Sherwood, Huntington, and Hampton Heights; there, the SNLR hit a sizzling 79% in June, driven by a 35% increase in sales and 9% increase in new listings. That’s helped push prices up 5% to an average of $491,179.
However, the region’s slowest market is currently in Hamilton Beach which, with a ratio of 37%, has seen conditions tumble significantly from last year; sales are down by -36.4%. While the supply of new listings has also been on the decline by -5%, it hasn’t been enough to firm up the market, which is now less competitive from a buying perspective. However, the neighbourhood continues to be one of the city’s more expensive with an average price of $686,250, up 13% compared to the same time period in 2018.
Check out the infographic below to see which Hamilton markets were most competitive for buyers in June:
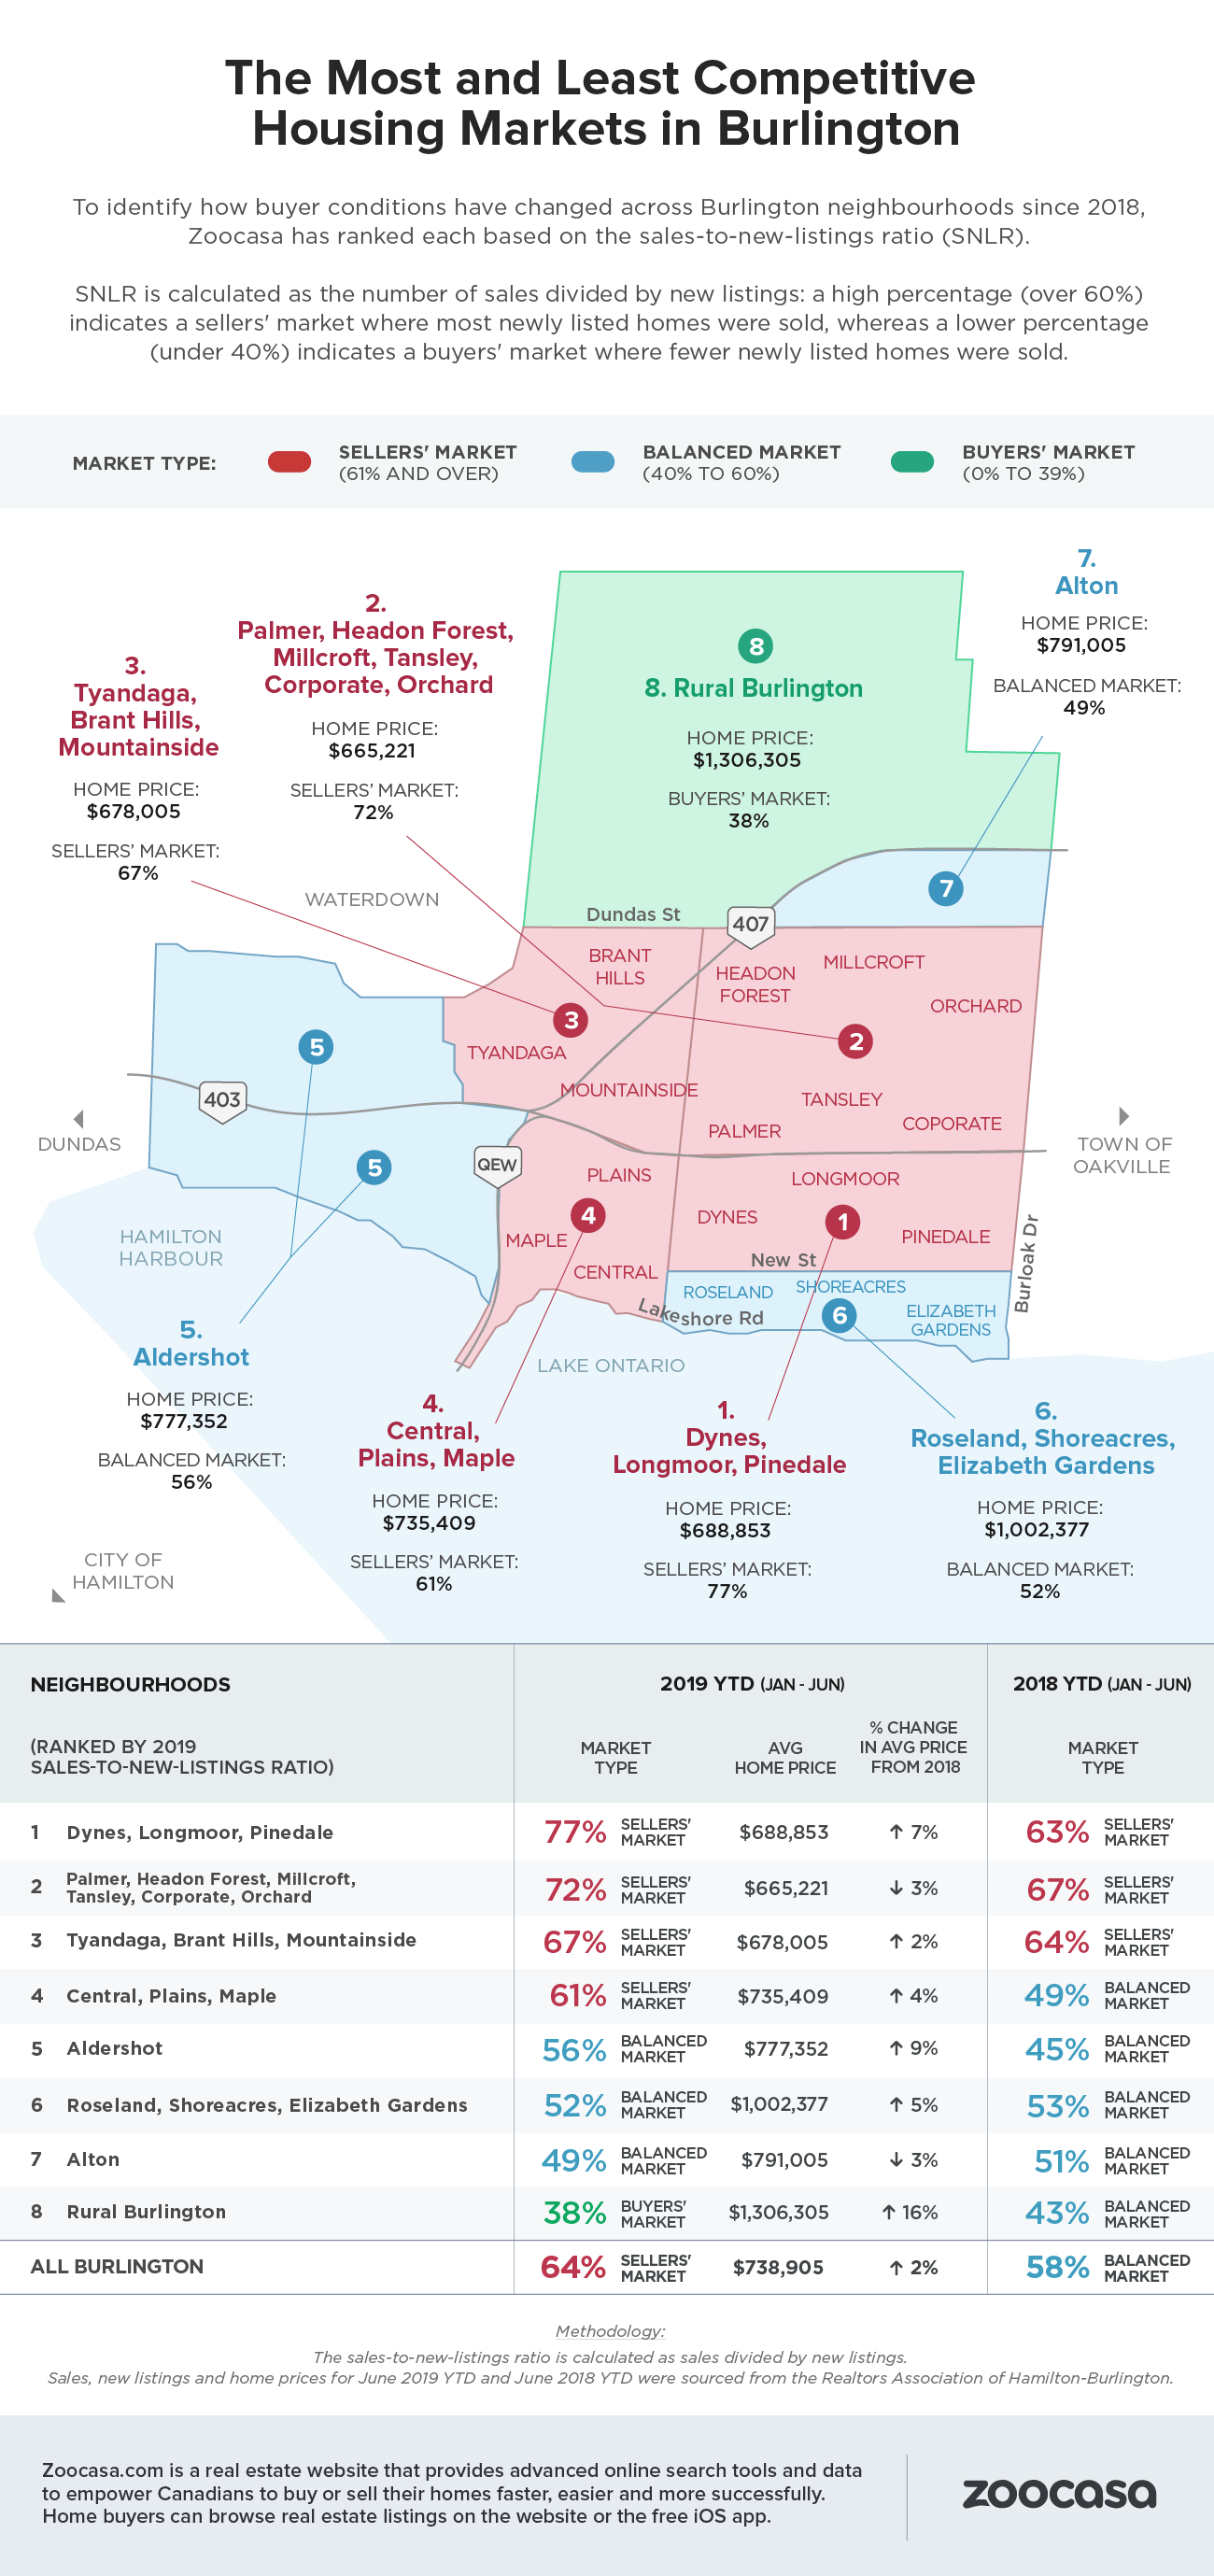
Burlington Now Officially a Sellers’ Market
It may be a smaller market compared it its Steeltown neighbour, but Burlington homes for sale have also experienced heating conditions; the region’s SNLR was 64% in June, an increase from 58% the year before. That’s reflective of a 9% jump in sales as the supply of new listings has remained flat, pushing the average home price up by 2% to $738,905.
Currently, the most competitive markets in the region are found in Dynes, Longmoore, and Pinedale, which remain deep in sellers’ territory with an SNLR of 77%, up from 63%. Sales rose a voracious 14% across these neighbourhoods while new listings retracted by -6.2%. That’s boosted the average home price by 7% to $688,853.
In contrast, the neighbourhoods of Roseland, Shoreacres, and Elizabeth Gardens remain on the lower end of balanced with an SNLR of 52%, down 1% year over year. That shift comes as overall conditions chill, with sales down 10.4%, and new listings by -8.8%. However, the average price in this high-end neighbourhood remains at a luxury price point at $1,002,377. Rural Burlington is the only buyers’ market in the region with an SNLR of 38%, a drop from 43% the year prior. That’s come as sales have dipped -4.5% while the supply of new listings rose 9.3%. This market also retained its luxury price point at an average of $1,306,305, up 16% year over year.
Check out the infographic below to see which Burlington markets were most competitive for buyers in June:
Methodology:
The sales-to-new-listings ratio is calculated as sales divided by new listings.
Sales, new listings and home prices for June 2019 YTD and June 2018 YTD were sourced from the Realtors Association of Hamilton-Burlington.
About Zoocasa
Zoocasa.com is a real estate website that provides advanced online search tools and data to empower Canadians to buy or sell their homes faster, easier and more successfully. Home buyers can browse real estate listings on the website or the free iOS app.