After several years of quieter real estate demand and activity, it appears the City of Calgary and surrounding regional markets are in store for an uptick. The quarterly Residential Market sales forecast released by the Canadian Real Estate Association in June finds that while sales are to trend downward by -0.9% in the province of Alberta as a whole this year, they’ll rebound by 4.7% in 2020.
However, a hotter pace of activity is already noticeable within the Calgary real estate market. According to
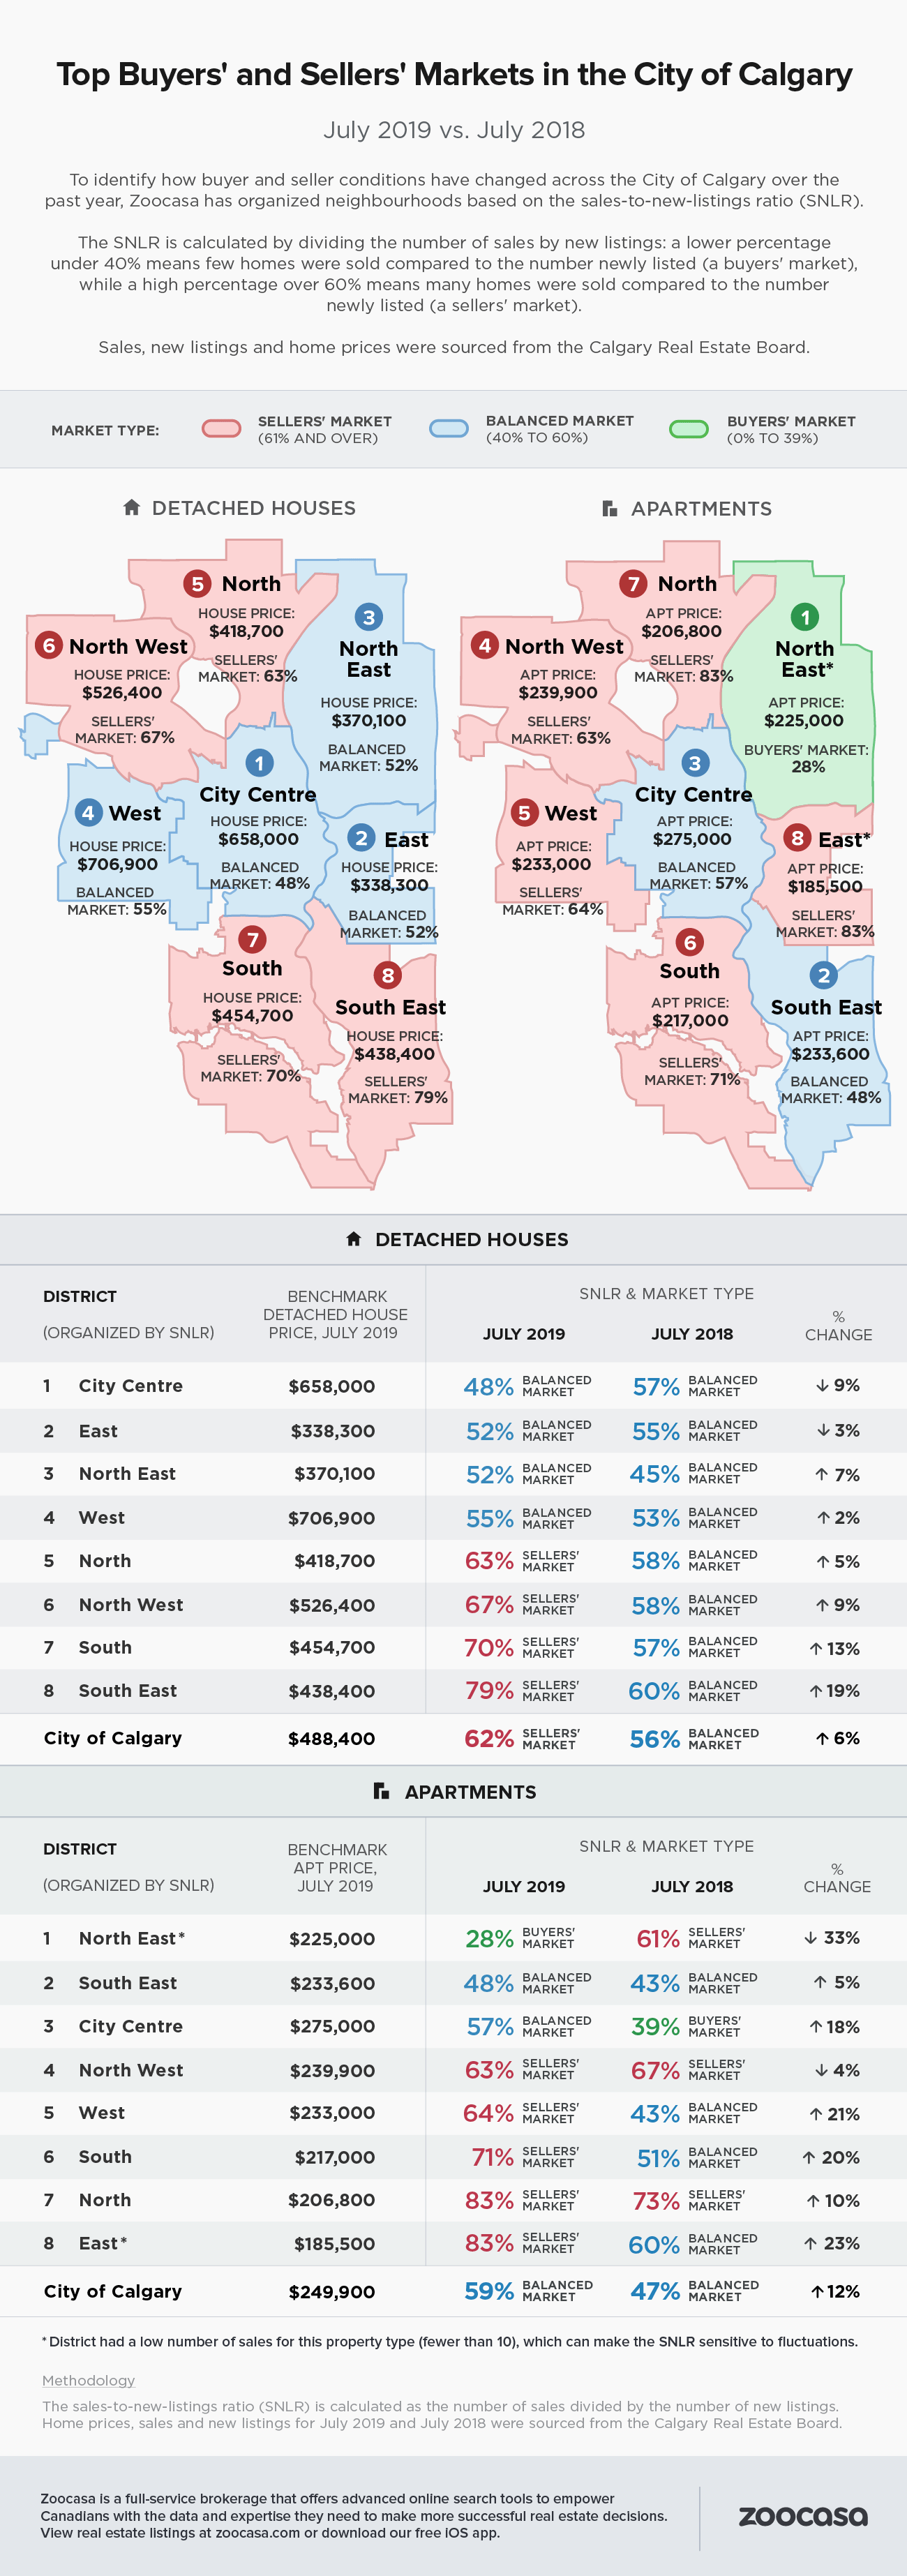
To determine whether a housing market can be considered a sellers’ market, buyers’ market, or balanced, the study looked at the sales-to-new-listings ratio (SNLR) in each market. This ratio, which is calculated by dividing the number of sales by the number of new listings brought to market during the month, helps assess the level of buyer competition; if the ratio is over 60%, that can be considered a sellers’ market, whereas it’s a buyers’ market if the ratio is under 40%. A ratio that falls within 40 – 60% indicates the market is balanced, with enough supply to meet buyer demand.
It’s important for both buyers and sellers to understand these dynamics in their local markets, as it’s key to setting their listing or offer strategies. For example, in a sellers’ market, buyers may find themselves competing against others in multiple-offer situations, which can drive up prices, and may also need to resort to tactics such as dropping offer conditions or being more flexible with closing. In a buyers’ market, however, they’re spoiled for more choice, often have greater leverage with the seller, and can still include financing and inspection conditions.
It’s a Sellers’ Market for Detached Houses in the City of Calgary
Based on this ratio, the market for detached houses for sale in Calgary is considered to be within sellers’ territory, with a percentage of 62%. That’s just over the threshold for seller-friendly conditions, though up considerably from the same month in
Four of the eight districts within the city can also be considered sellers’ markets; the remaining are balanced, and none qualify as buyers’ markets.
The hottest sellers’ conditions for detached houses can be found in the South East district, which has an SNLR of 79%, an increase of 18% from last year. However, rather than indicate hot demand, this reflects supply has fallen in relation to flat sales: a total of 157 houses sold, up just 2.5% year over year, compared to 199 new listings, a decline of -21%. It’s a similar scenario in the North West, which, with an SNLR 67%, is the third hottest for houses in the city. Sales are lagging behind last year’s numbers by -1.9% with 152 transactions, while the number of new listings plunged by -14.9%.
Things are considerably more active in the South district, however; sales rose a whopping 26.4% with 234 transactions in July, well outpacing a 3% increase in new listings (334). That’s pushed the local SNLR to 70%, an increase of 13% from last year.
Fierce buyer competition isn’t just reserved for detached houses within the city; five of the districts can also be considered sellers’ markets for apartment sales, while two remain balanced and one (the North East) within buyers’ territory.
Check out the infographic below to see which districts within the City of Calgary can be considered buyers’ and sellers’ markets for detached house and apartment sales.
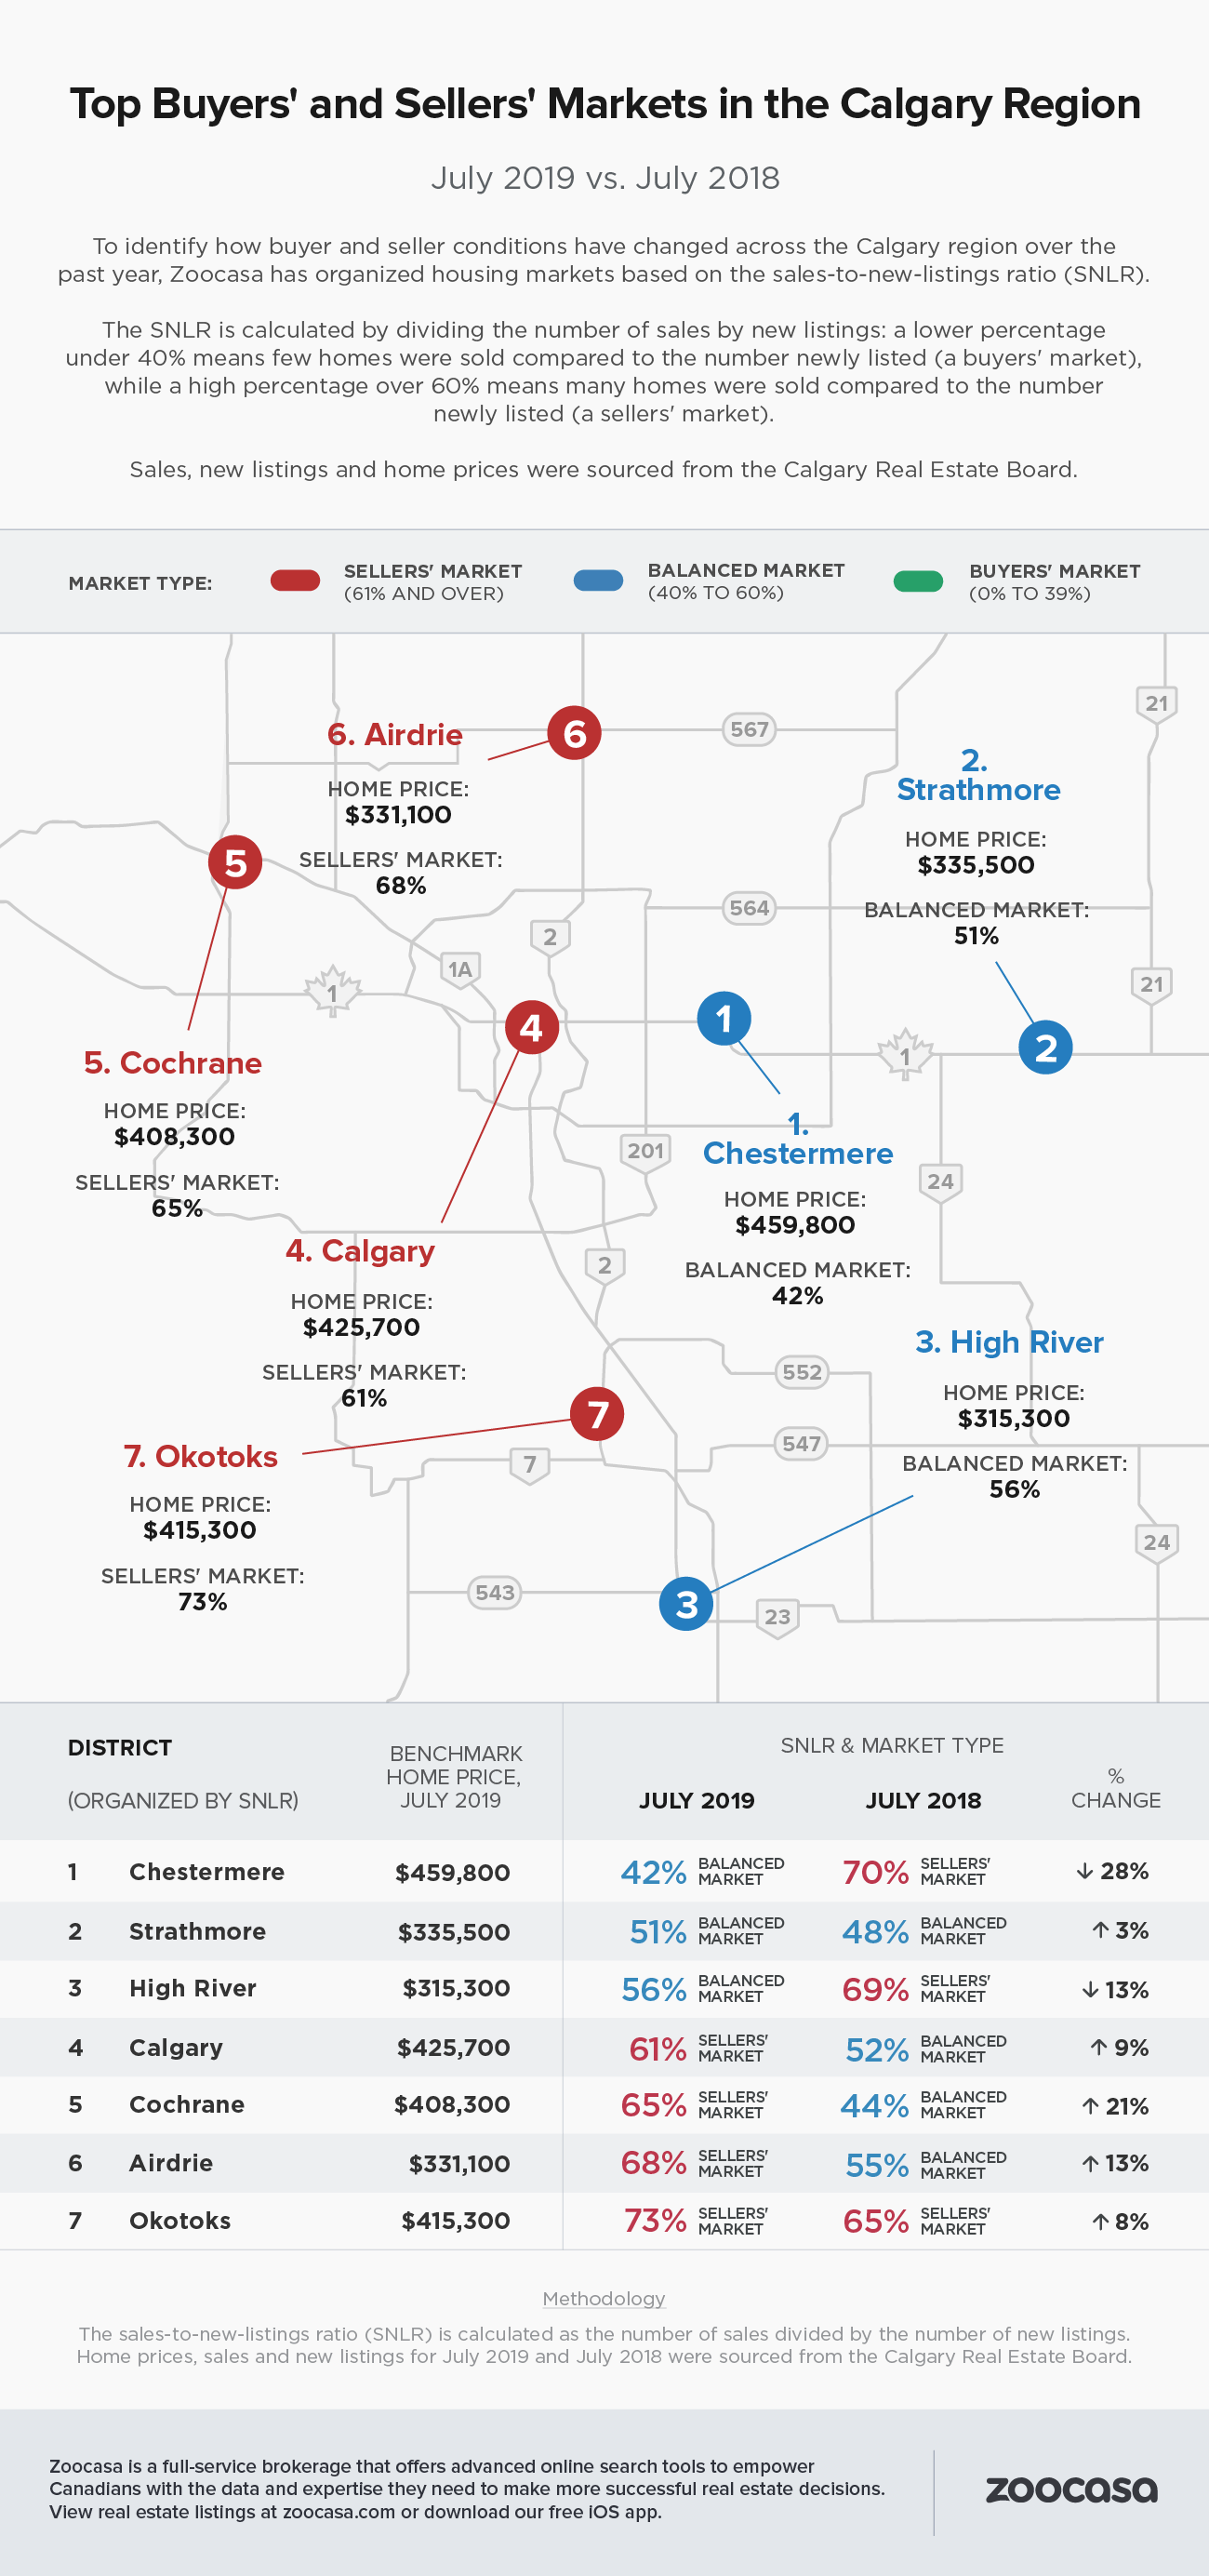
Calgary Region Markets Also Heating Up
Hotter activity has started to expand beyond city limits, with four of seven local market featuring SNLRs above 60%, while the remainder can be considered balanced.
The municipality of Okotoks takes the top spot for the tightest sellers’ market with a ratio of 73%, up 8% year over year and reflecting a 3.7% increase in sales (55) while new listings have fallen -7.4% (75). That’s followed by Airdrie with a ratio of 68% (+13%), a dramatic uptick caused by a 13% increase in sales (125), while new listings have fallen by -8.5% (184).
Cochrane rounds out the top three sellers’ markets with a ratio of 65% (+21%), but due to different fundamentals; rather than a surging market, sales have remained flat year over year with 61 transactions, while only 94 new listings were brought to market, a decline of -31.8%
Check out the infographic below to see which municipalities within the Calgary region can be considered buyers’ and sellers’ markets.
Methodology
The sales-to-new-listings ratio (SNLR) is calculated as the number of sales divided by the number of new listings. Home prices, sales and new listings for July 2019 and July 2018 were sourced from the Calgary Real Estate Board.
For more information about this report or to set up a media interview, please email [email protected].
About Zoocasa
Zoocasa is a full-service brokerage that offers advanced online search tools to empower Canadians with the data and expertise they need to make more successful real estate decisions. View real estate listings at zoocasa.com or download our free iOS app.