The busy back-to-school market has been winding down, as darker evenings and cooler weather chilled the pace of home sales and new listings throughout October; however, while year-over-year growth was smaller last month than compared to September, it still clocked in well above 2018 levels with 8,491 transactions, an increase of 14%, according to the latest data released by the Toronto Real Estate Board.
All types of homes for sale saw transactions edge up year over year, while home price growth continued to rise; the average home now fetches a price of $852,142, up 5.5%. The MLS Home Price Index, which measures the overall value of homes sold, also rose 5.8% year over year – the strongest annual rate of growth since December 2017, and indicating that higher-priced homes, such as detached houses, are contributing more to the overall sales mix.
Supply and Demand Continue to Diverge
While TREB’s analysts point to a number of factors fueling rising prices, the main issue remains a lack of new supply – the number of newly-listed homes fell 9.6% in October, widening the supply-and-demand gap and heating competition between home buyers. Currently, the Greater Toronto Area can be classified as a steep sellers’ market, with a sales-to-new-listings ratio of 65%, up from a balanced ratio of 51% one year ago.
TREB President Michael Collins expressed concern that this growing imbalance, combined with steady migration to the area, will return the market to the unsustainable price growth trends that defined the 2016 – early 2017 peak. He stated, “A strong regional economy obviously fuels population growth. All of these new households need a place to live and many have the goal of purchasing a home. The problem is that the supply of available listings is actually dropping, resulting in tighter market conditions and accelerating price growth.”
TREB’s Chief of Market Analysis Jason Mercer, adds that prices are poised to rise at an even faster pace in the future, as long as the disconnect between sales and new listings persist.
“As market conditions in the GTA have steadily tightened throughout 2019, we have seen an acceleration in the annual rate of price growth. While the current pace of price growth remains moderate, we will likely see stronger price growth moving forward if sales growth continues to outpace listings growth, leading to more competition between buyers,” he stated.
Strongest Sales Growth Seen in 905 Markets
The strongest uptick in activity was experienced in the 905 region, which includes the Halton, Brampton, and Mississauga real estate markets. Sales rose by a booming 17% with 5,196 transactions, and prices up 5.2% to an average of $805,623. The region is suffering from the same lack of new supply, as new listings dipped -11.7%, leading to a steep sellers’ market with a ratio of 64%.
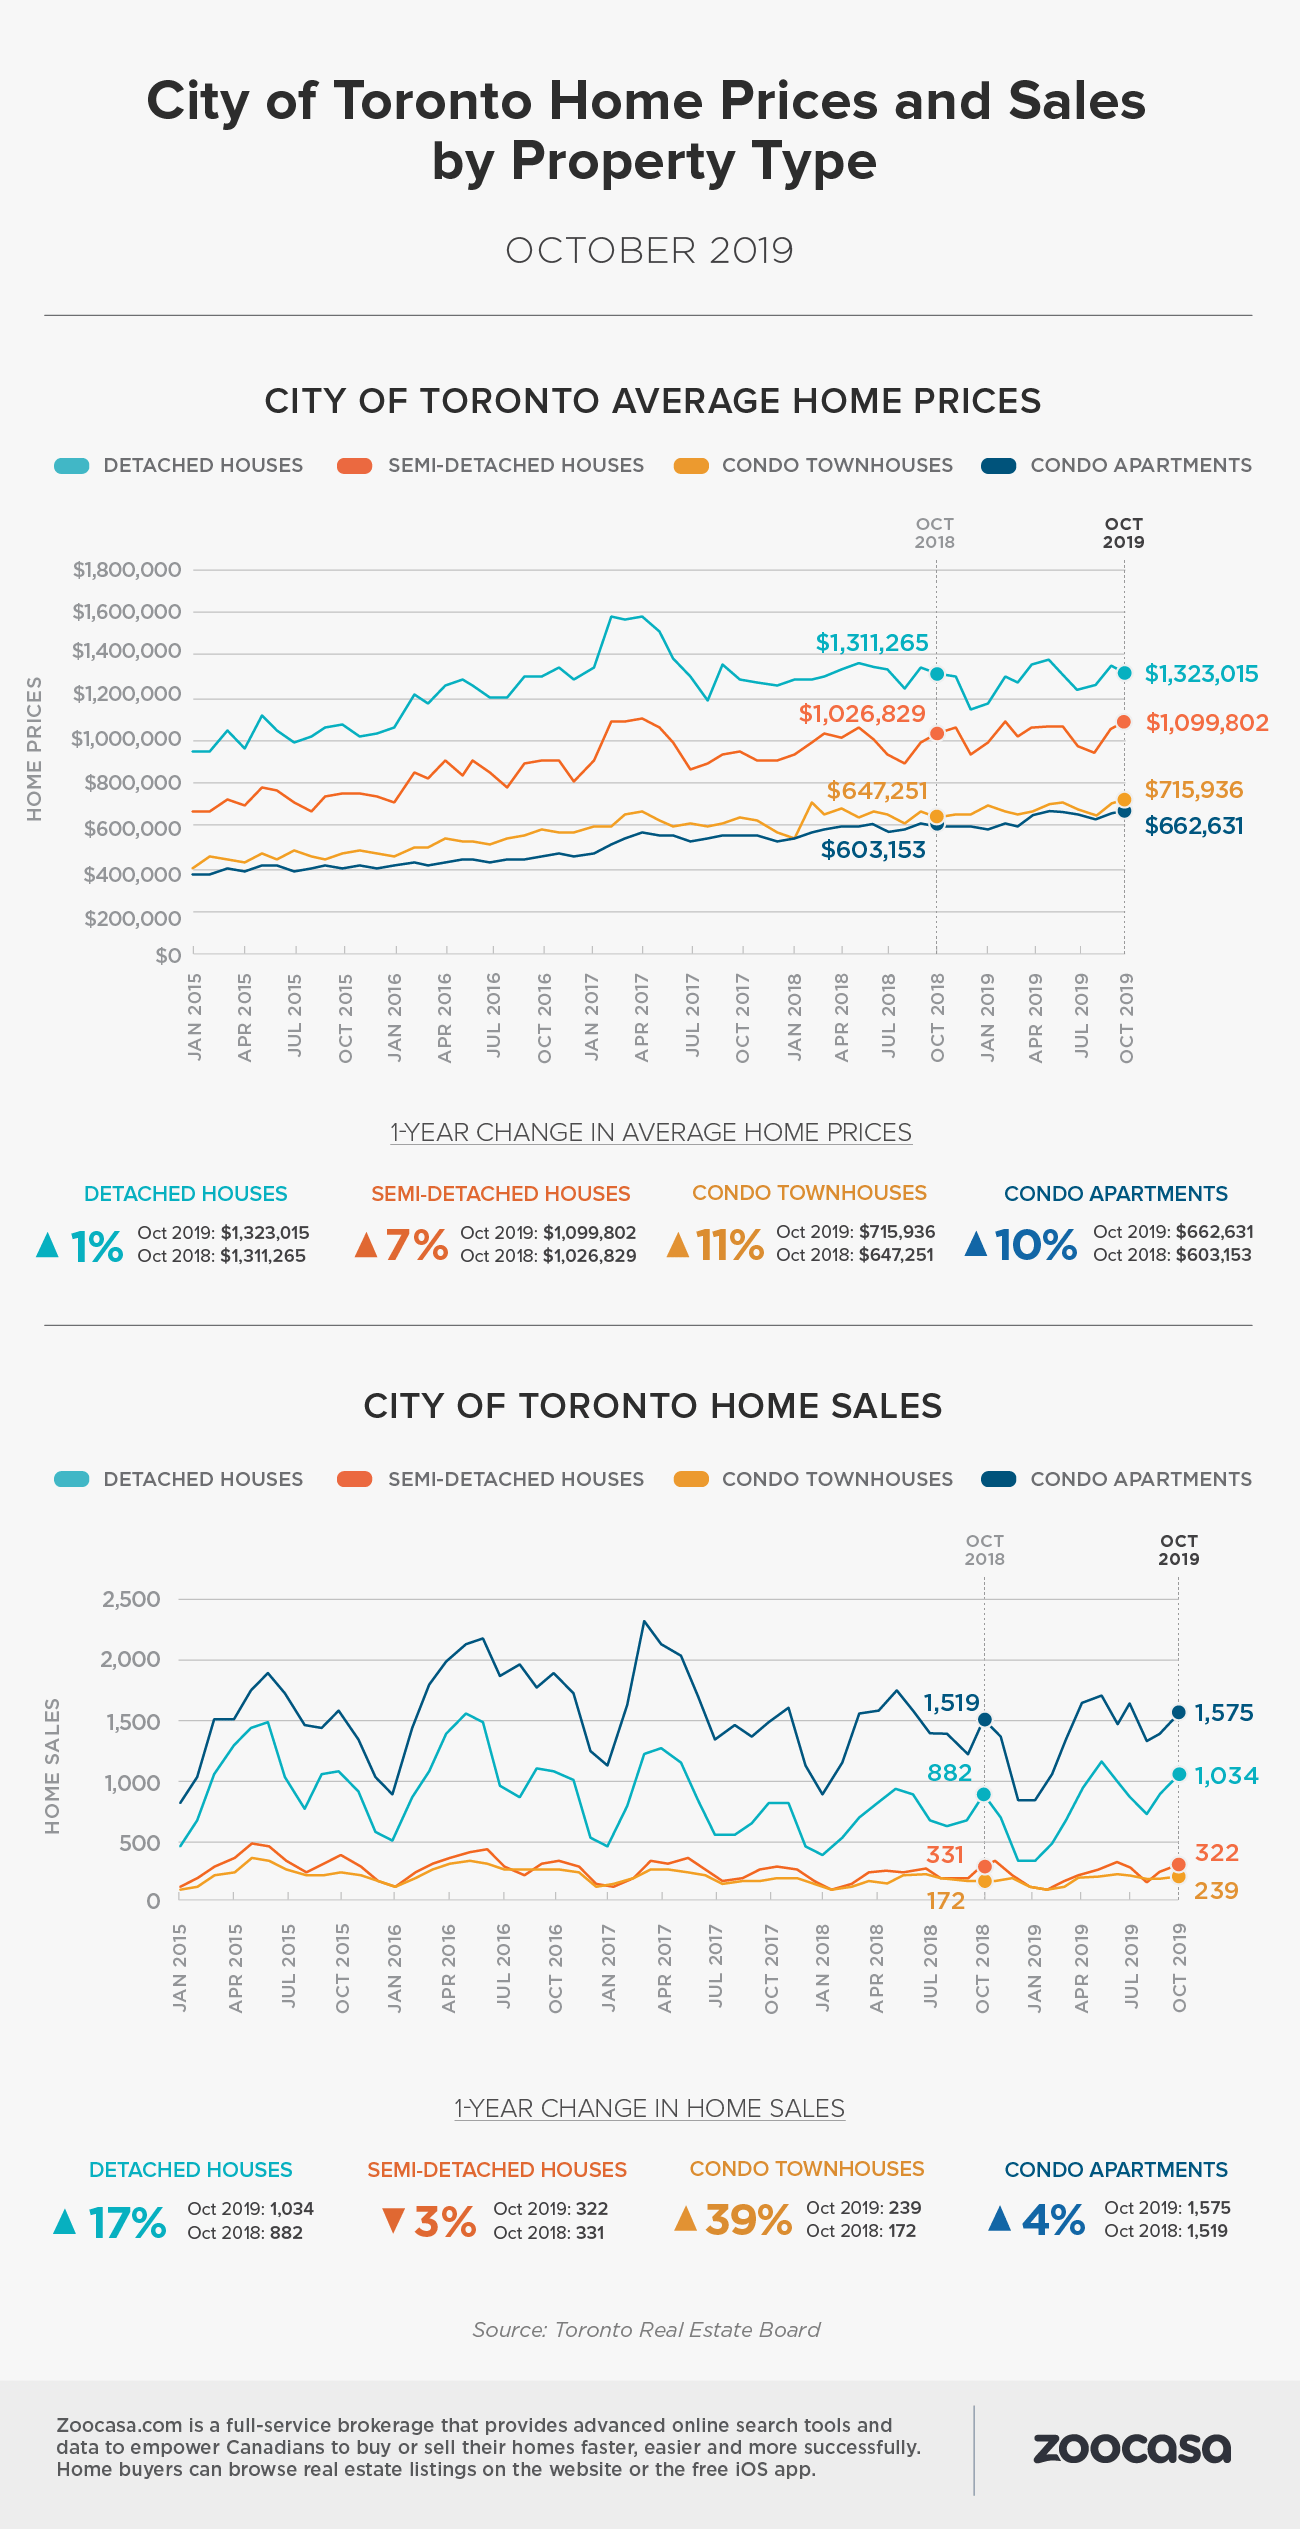
Sales growth was less robust within the City of Toronto, which, at 3,295 transactions, increased by 9.4%. However, prices rose at the sharpest clip in the city, rising 6.3% to an average of $925,498. New listings fell -5.9%, and the sales-to-listings ratio remains firmly in sellers’ territory at 66.5%.
Condos Continue to Lead Market in Price Growth
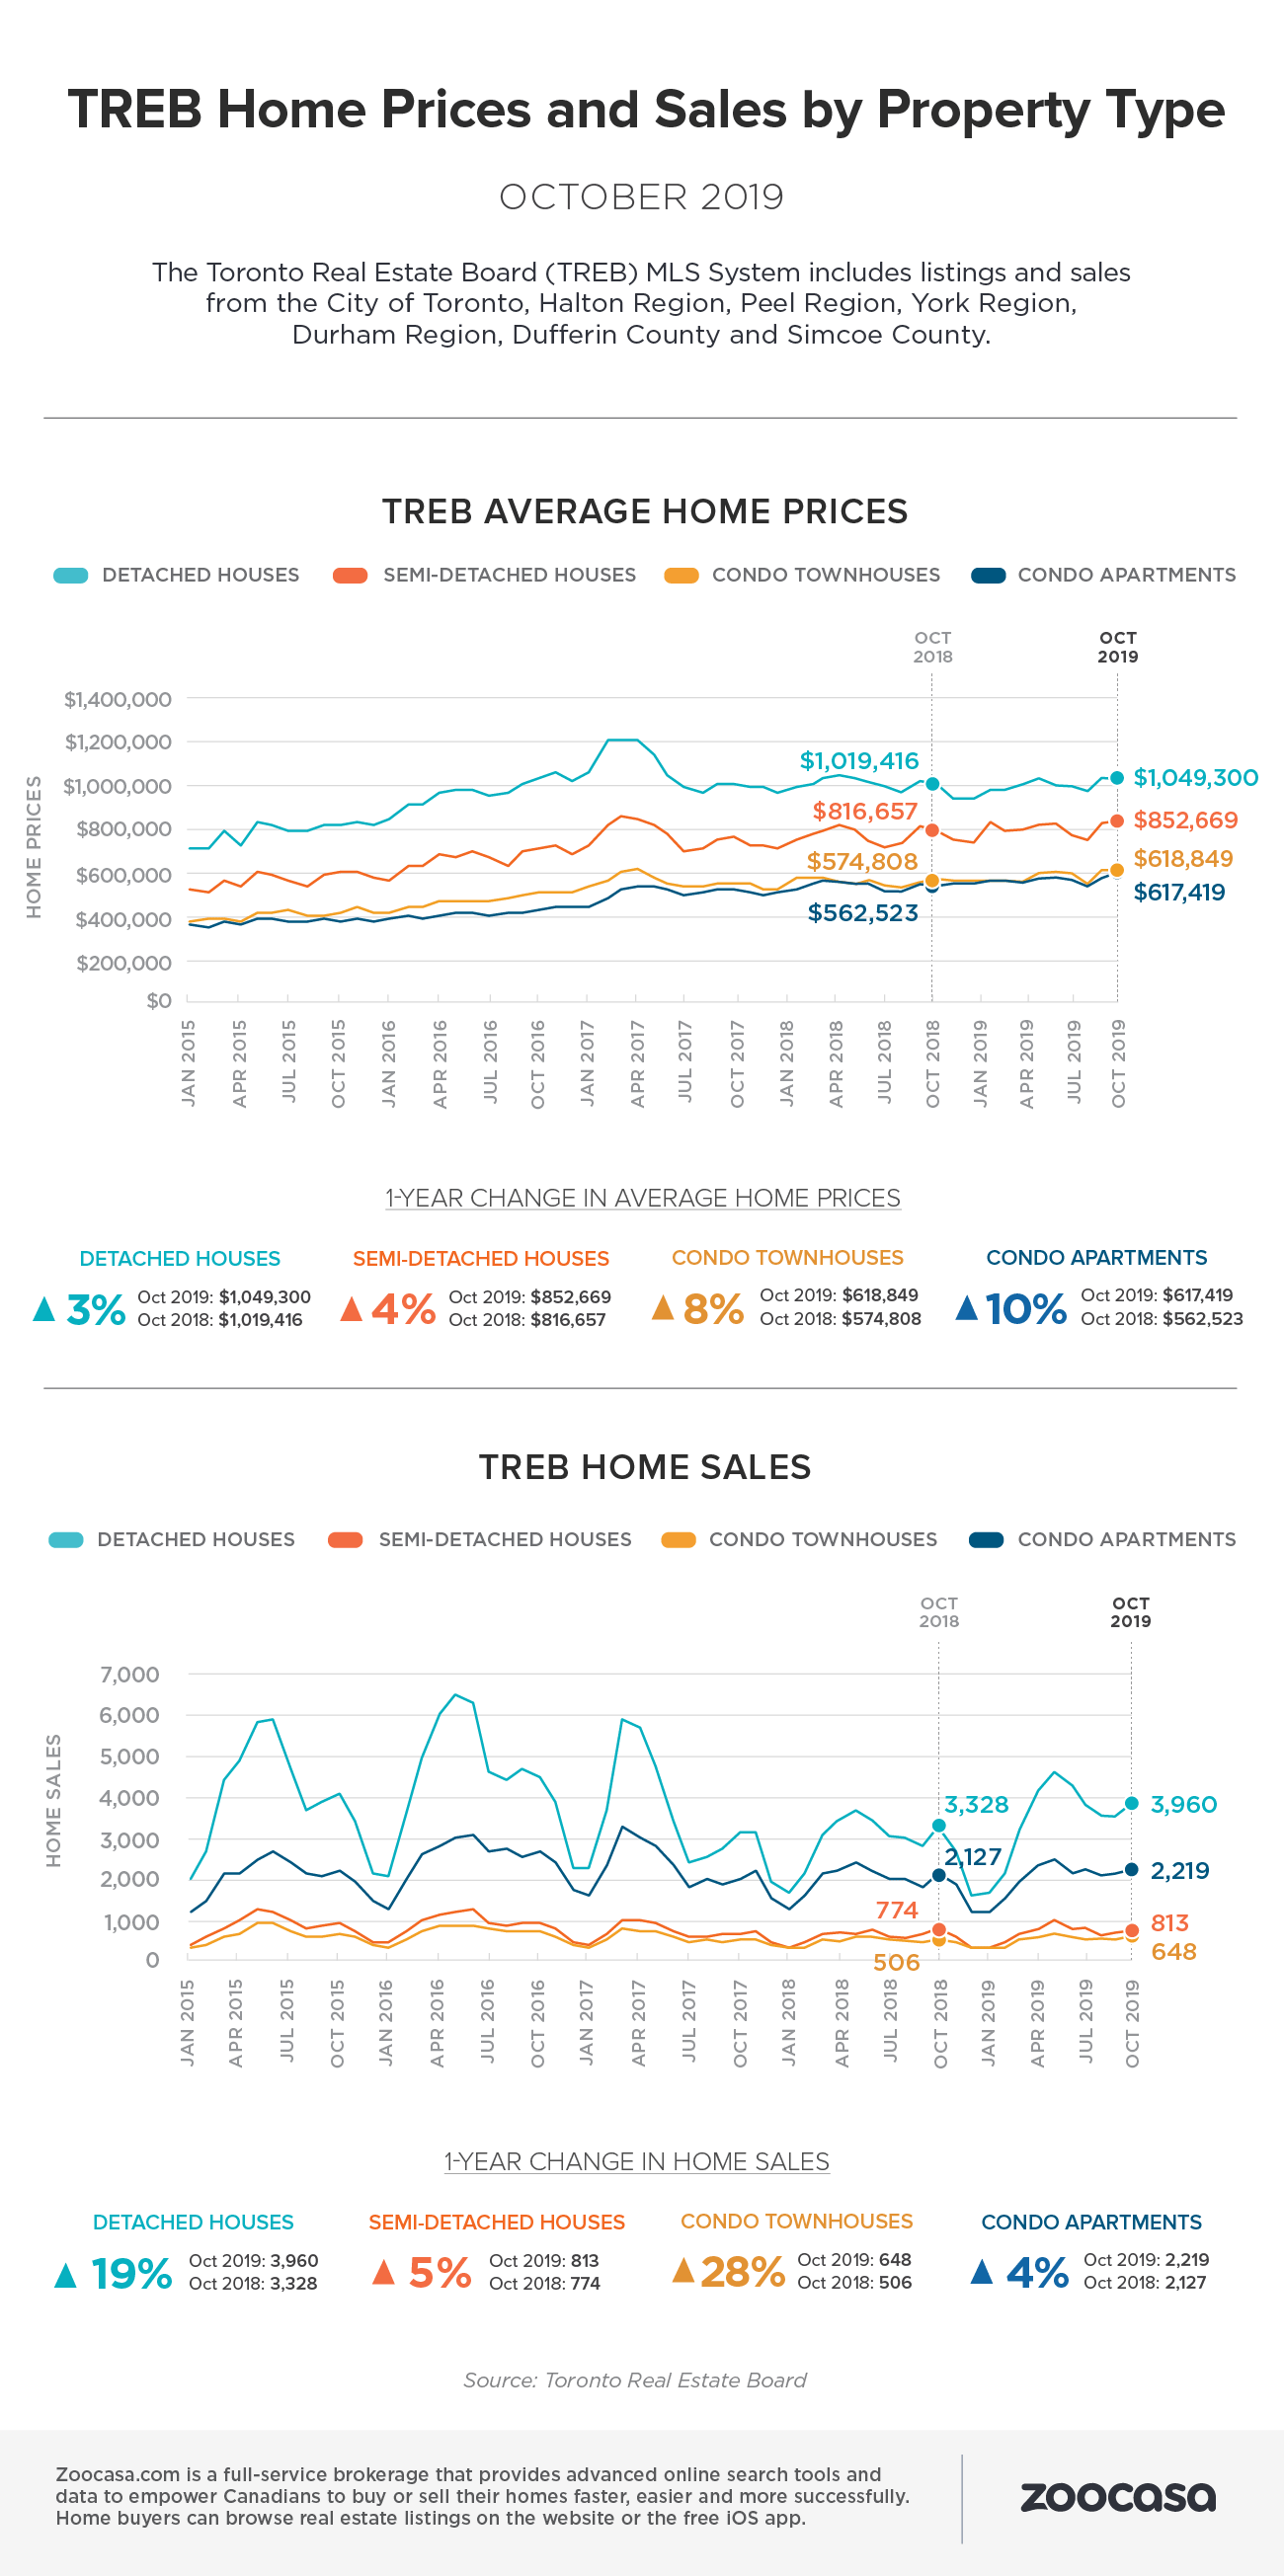
As has been the longterm trend, the sharpest increase in price growth was seen at the most affordable end of the market; condo unit prices rose 9.6% year over year, to an average of $617,429. That well outpaces all other home types; semi-detached houses experienced an increase of 4.2% to $852,669, while townhouse prices rose 3.1% to $676,802. Detached houses remain above the $1-million mark at $1,049,300, up 3%.
However, rising demand remained hot for single-family homes, with detached sales surging 19.6%. Townhouses saw the greatest increase at 21.3%, perhaps indicating that buyers continue to seek low-rise housing at the lowest possible price point. Semi-detached houses and condos each saw sales increases of 5.9% and 5.1%, respectively.
Check out the infographics below to see how sales and prices have increased across all home types in the 905 and 416 markets: