Buying real estate is widely considered to be one of the safest and most effective ways to grow your money: a sentiment that 68% of long-term homeowners agreed with, according to a recent study conducted by Zoocasa.com.
It’s true that many property owners likely saw immense returns over the course of the booming sellers’ conditions that defined Canadian housing markets in 2016 and early 2017. However, as the Canadian Real Estate Association has reported sales and prices fell 12.6% and 2.9% last month, does the same still hold true in today’s softer market?
Related Read: Long-term Homeowners Most Confident in Canadian Housing Market
To find out, Zoocasa calculated the change in value of an average home, assessing gains and losses in three key Canadian housing markets over the course of 2018 – the Greater Toronto Area, Greater Vancouver, and Calgary. Those findings were then compared to returns across the following three investment types:
- A high-interest savings account (+1.1% y-o-y)
- The S&P / TSX Composite Index (-11.6% y-o-y)
- The S&P Canada Aggregate Bond Index (+1.5% y-o-y)
Whether or not your home’s value appreciation exceeded these index and passive investments depends on the market; a combination of provincial policies, federal mortgage rules, and overall price fatigue has cooled markets across Canada, though not at the same rate.
Check out how Canada’s housing markets compared to other investments over the course of 2018 in the infographic below:
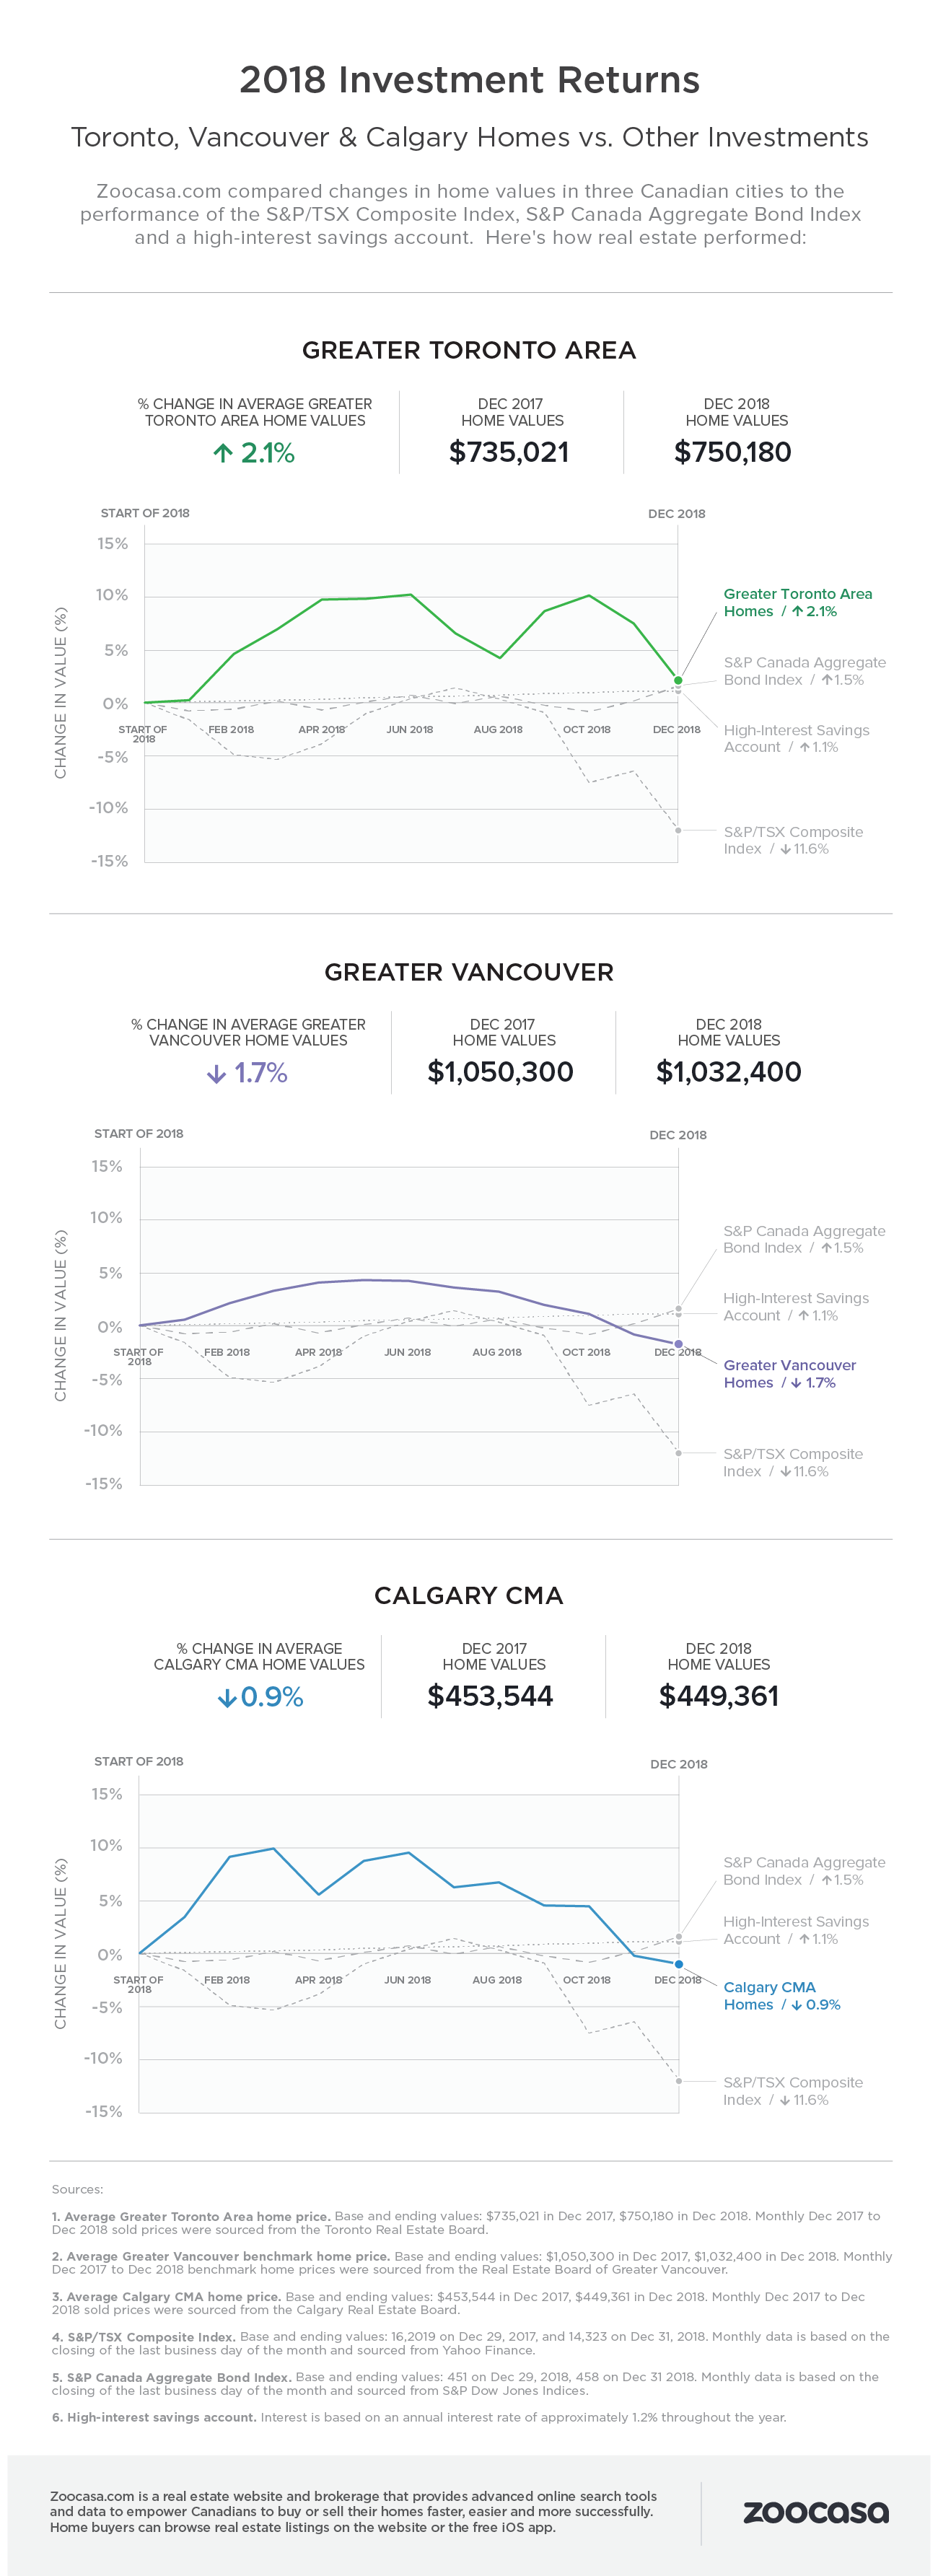
Strongest Growth Seen in the GTA
GTA buyers got the most bang for their buck at the end of 2018, with an increase in home value of 2.1%, at an average price of $750,180 for Toronto homes for sale. That’s in the black by $15,159 from the start of the year, but falls considerably below this year’s June market peak, where prices soared 9.9% to an average of $807,871.
The GTA is also the only housing market of the three to outpace every alternative investment type.
Vancouver: A Sharp Year-over-Year Drop
Back in 2017, there weren’t many investments that could outpace the growth of the Vancouver MLS, which had shot up 10.7% over the course of the year. It was a much cooler reality in 2018 for west coast homeowners, with an overall 1.7% decline in home prices by December, at an average of $1,032,400.
While the market saw early-year gains, peaking at a total of $1,094,000 (+4.2%) in May, they steadily decreased at a monthly rate thereafter, in what the British Columbia Real Estate Association refers to as fallout from tougher mortgage rules and smaller home buyer budgets.
Calgary: A Roller Coaster for Home Values
Calgary real estate saw home prices end the year on a fairly flat note, falling 0.9% year over year to an average value of $449,361 – just a $4,183 drop from the previous December, but considerably lower than the city’s March market peak, which saw home prices surge 9.6% to $497,252. The Calgary Real Estate Board has pointed to a softer job market, challenges in the oil industry, and tougher mortgage lending rules as factors behind chillier market demand and appreciation.
Sources:
1. Average Greater Toronto Area home price. Base and ending values: $735,021 in Dec 2017, $750,180 in Dec 2018. Monthly Dec 2017 to Dec 2018 sold prices were sourced from the Toronto Real Estate Board.
2. Average Greater Vancouver benchmark home price. Base and ending values: $1,050,300 in Dec 2017, $1,032,400 in Dec 2018. Monthly Dec 2017 to Dec 2018 benchmark home prices were sourced from the Real Estate Board of Greater Vancouver.
3. Average Calgary CMA home price. Base and ending values: $453,544 in Dec 2017, $449,361 in Dec 2018. Monthly Dec 2017 to Dec 2018 sold prices were sourced from the Calgary Real Estate Board. Average Montreal home price
4. S&P/TSX Composite Index. Base and ending values: 16,2019 on Dec 29, 2017, and 14,323 on Dec 31, 2018. Monthly data is based on the closing of the last business day of the month and sourced from Yahoo Finance.
5. S&P Canada Aggregate Bond Index. Base and ending values: 451 on Dec 29, 2018, 458 on Dec 31, 2018. Monthly data is based on the closing of the last business day of the month and sourced from S&P Dow Jones Indices.
6. High-interest savings account. Interest is based on an annual interest rate of approximately 1.2% throughout the year.
ABOUT ZOOCASA
Zoocasa.com is a real estate company that combines online search tools and a full-service brokerage to empower Canadians to buy or sell their homes faster, easier and more successfully. Home buyers can browse real estate listings on the website or the free Zoocasa real estate iOS app.
For more information about this study or to set up a media interview please email [email protected].