
Looking to call our nation’s capital home? Those combing through MLS Ottawa listings are likely contending with serious competition, as much of the city has become a bonafide sellers’ market.
Packed open houses, bidding wars, and properties selling for well above asking – all symptoms of sizzling sellers’ conditions – have become the norm according to the Ottawa Real Estate Board (OREB). In fact, while the number of sales in the city declined in March, it wasn’t due to lack of demand, but too-short supply; Ottawa’s strong job market has spurred heavy migration to the region, putting upward pressure on prices and heating housing demand to
OREB reveals a total of 1,136 houses sold last month, down 12.4%, while the average price surged 7.2% to $480,143. Activity was stronger for condos for sale in Ottawa, which saw a 5% uptick in activity with 375 units changing hands, at an average price of $290,181.
8 of 10 Neighbourhoods in Sellers’ Territory
Recent data compiled by Zoocasa finds that these hotly competitive buyer conditions have persisted through the first quarter of the year, with no indication of slowing any time soon. The study sourced the average home price, sales, and
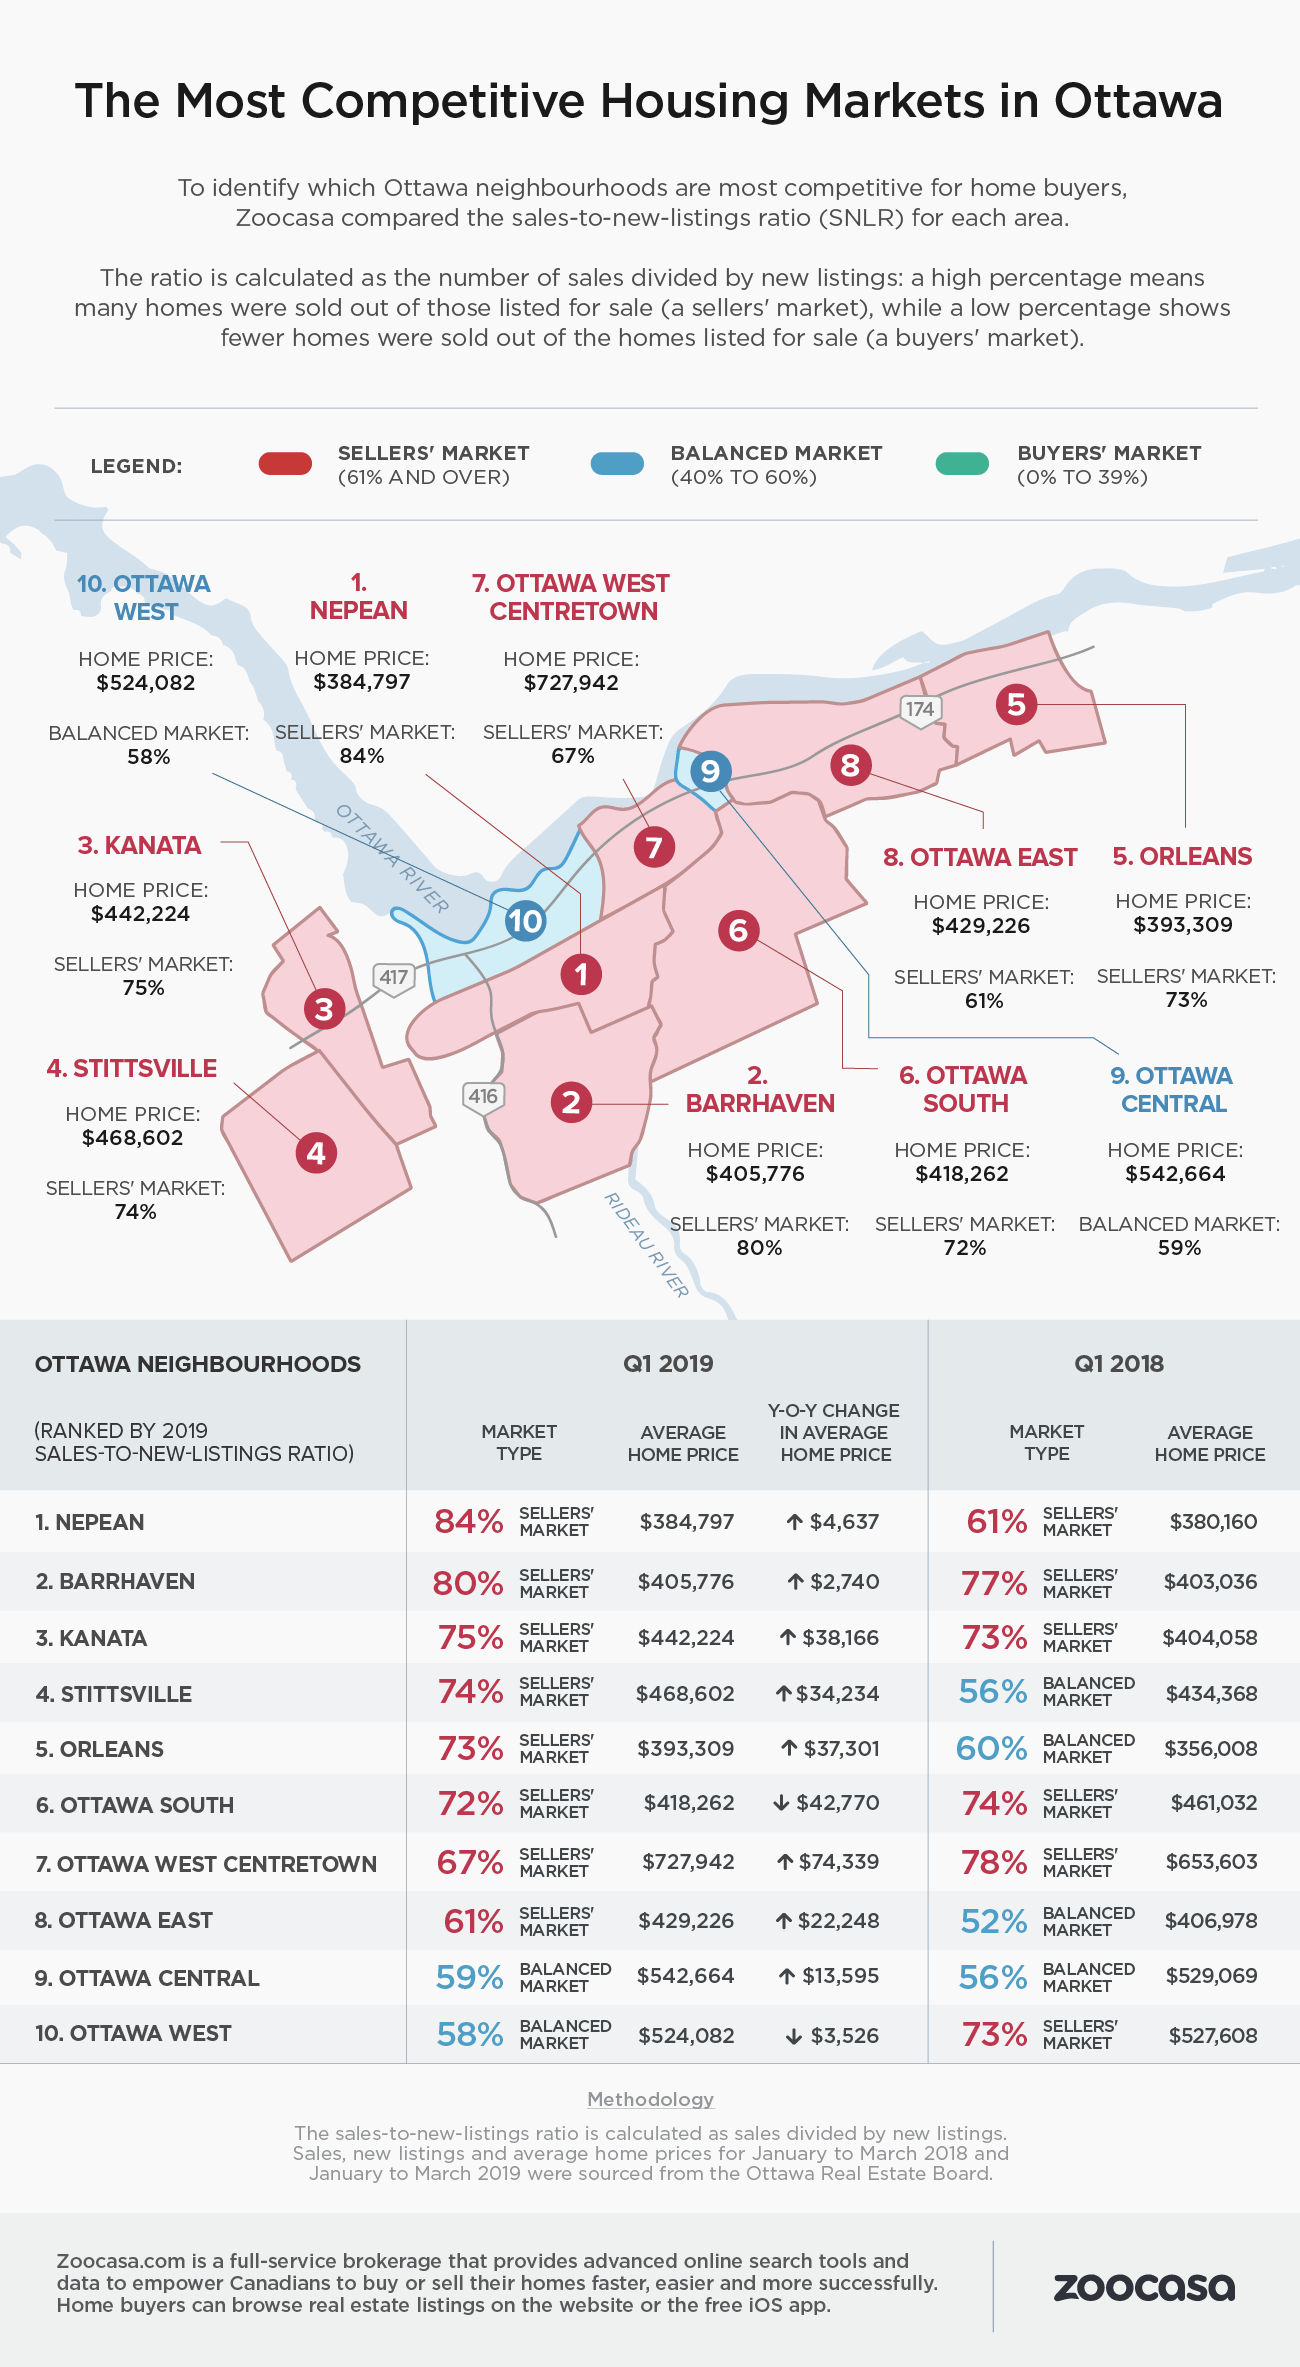
It revealed eight of the 10 neighbourhoods studied fall within the definition of a sellers’ market. Only two can be considered balanced, and none fall within buyers’-friendly territory. Further, seven of the 10 neighbourhoods saw buyer conditions become more competitive this year than in 2018.
“Sellers with well-presented and competitively priced properties are at an advantage,” says Jonathan Amodeo, a broker with Zoocasa in Ottawa. “As the spring market heats up, I anticipate more multiple offers and shorter days on market for these types of properties compared to last year.”
Amodeo says this is partly due to fewer listings, and also a result of more buyers on the market due to government housing measures in support of first-time buyers. He recommends that serious buyers stay on top of new listings and not hesitate to put in an offer on the right property.
What Defines a Sellers’ Market?
Whether or not a market can be defined as balanced, or more advantageous to buyers or sellers is determined by its sales-to-new-listings ratio (SNLR). This metric is calculated by dividing the number of sales by the number of new listings introduced over a specific time frame. A ratio that falls between 40 – 60% can be considered balanced, with above and below that threshold to be sellers’ and buyers’ markets, respectively.
Having a high SNLR doesn’t automatically mean a market is unaffordable, rather demand is outpacing available supply. However, markets
Nepean, Barrhaven, Are Most Competitive Ottawa Markets
According to the study, the neighbourhood of Nepean has the tightest sellers’ market in Ottawa, with an SNLR of 84%. This reflects a sharp 20% increase in year-over-year sales, while the number of new listings plunged by -12%. Demand is likely driven by the fact that Nepean is among the most affordable neighbourhoods in the city and a great option for first-time buyers with an average home price of $384,797 (+1% y-o-y).
Barrhaven – another neighbourhood renowned for its affordability – is the second most competitive, with an
Kanata rounds out the top three with a ratio of 75%; while sales have remained relatively unchanged, up 1% since Q1 2018, new listings fell by -3%. The neighbourhood has also experienced ferocious price growth, up 9% to $442,224.
Balance Found in Ottawa West, Central
Buyers seeking greater balance can instead look to Ottawa West; despite a higher average price tag of $524,082, its SNLR of 58% indicates much calmer conditions, though still on the cusp of a sellers’ market. It’s a considerable chill from the same time period last year, with the ratio hovered at a lofty 75% – however, a -5% decline in sales and 20% influx of new listings has eased some of that pressure.
The only other balanced neighbourhood on the list can be found in Ottawa Central, which has a ratio of 59%. The area has experienced flat year-over-year sales and a -6% decline in new listings. That’s tightened conditions from 56% last year, and pushed prices up by 3% to an average of $542,664.
Check out the infographic below to see how buyers’ and sellers’ conditions vary across the Ottawa housing market:
3 Hottest Ottawa Sellers’ Markets
1 – Nepean
SNLR: 84%
Average Home Price: $384,797
2 – Barrhaven
SNLR: 80%
Average Home Price: $405,776
3 – Kanata
SNLR: 75%
Average Home Price: $442,224
3 Most Balanced Ottawa Markets
1 – Ottawa West
SNLR: 58%
Average Home Price: $524,082
2 – Ottawa Central
SNLR: 59%
Average Home Price: $542,664
3 – Ottawa East
SNLR: 61%
Average Home Price: $429,226