2019 has proven to be a strong year for real estate demand across Ontario’s Greater Golden Horseshoe markets; prices were up across the region, as the “spillover effect” – the stream of buyers from the City of Toronto moving to markets beyond the GTA – continues to extend as far as Niagara.
Buyer intentions were re-invigorated last year following a softer 2018 due to a combo of lower mortgage rates and overall acclimation to the federal mortgage stress test; put in place to cool risky borrowing practices, the test requires mortgage borrowers to qualify at a higher rate than the one they’ll actually get from their lender. While this sidelined a number of would-be buyers over the course of 2018, they started returning the market in earnest in the second half of last year, often with larger down payments saved.
This effect was certainly evident in Hamilton, which has been a hot draw for GTA buyers; the city offers several amenities attractive to those who prefer an urban lifestyle such as an indie arts scene, celebrated local culinary destinations, and several neighbourhoods with great walkability. According to the Realtors Association of Hamilton-Burlington (RAHB), this translated to a 10.1% increase in sales last year, with a total of 12,866 transactions.
Buyers are also drawn to the city’s comparable affordability across a variety of housing types – transactions among houses for sale in Hamilton rose 15.5% in 2019, while condos for sale in Hamilton were also
Related Read: Did You Earn As Much as GTA Real Estate in 2019?
Hamilton Sellers’ Market Pushing Prices Higher Than Some Incomes
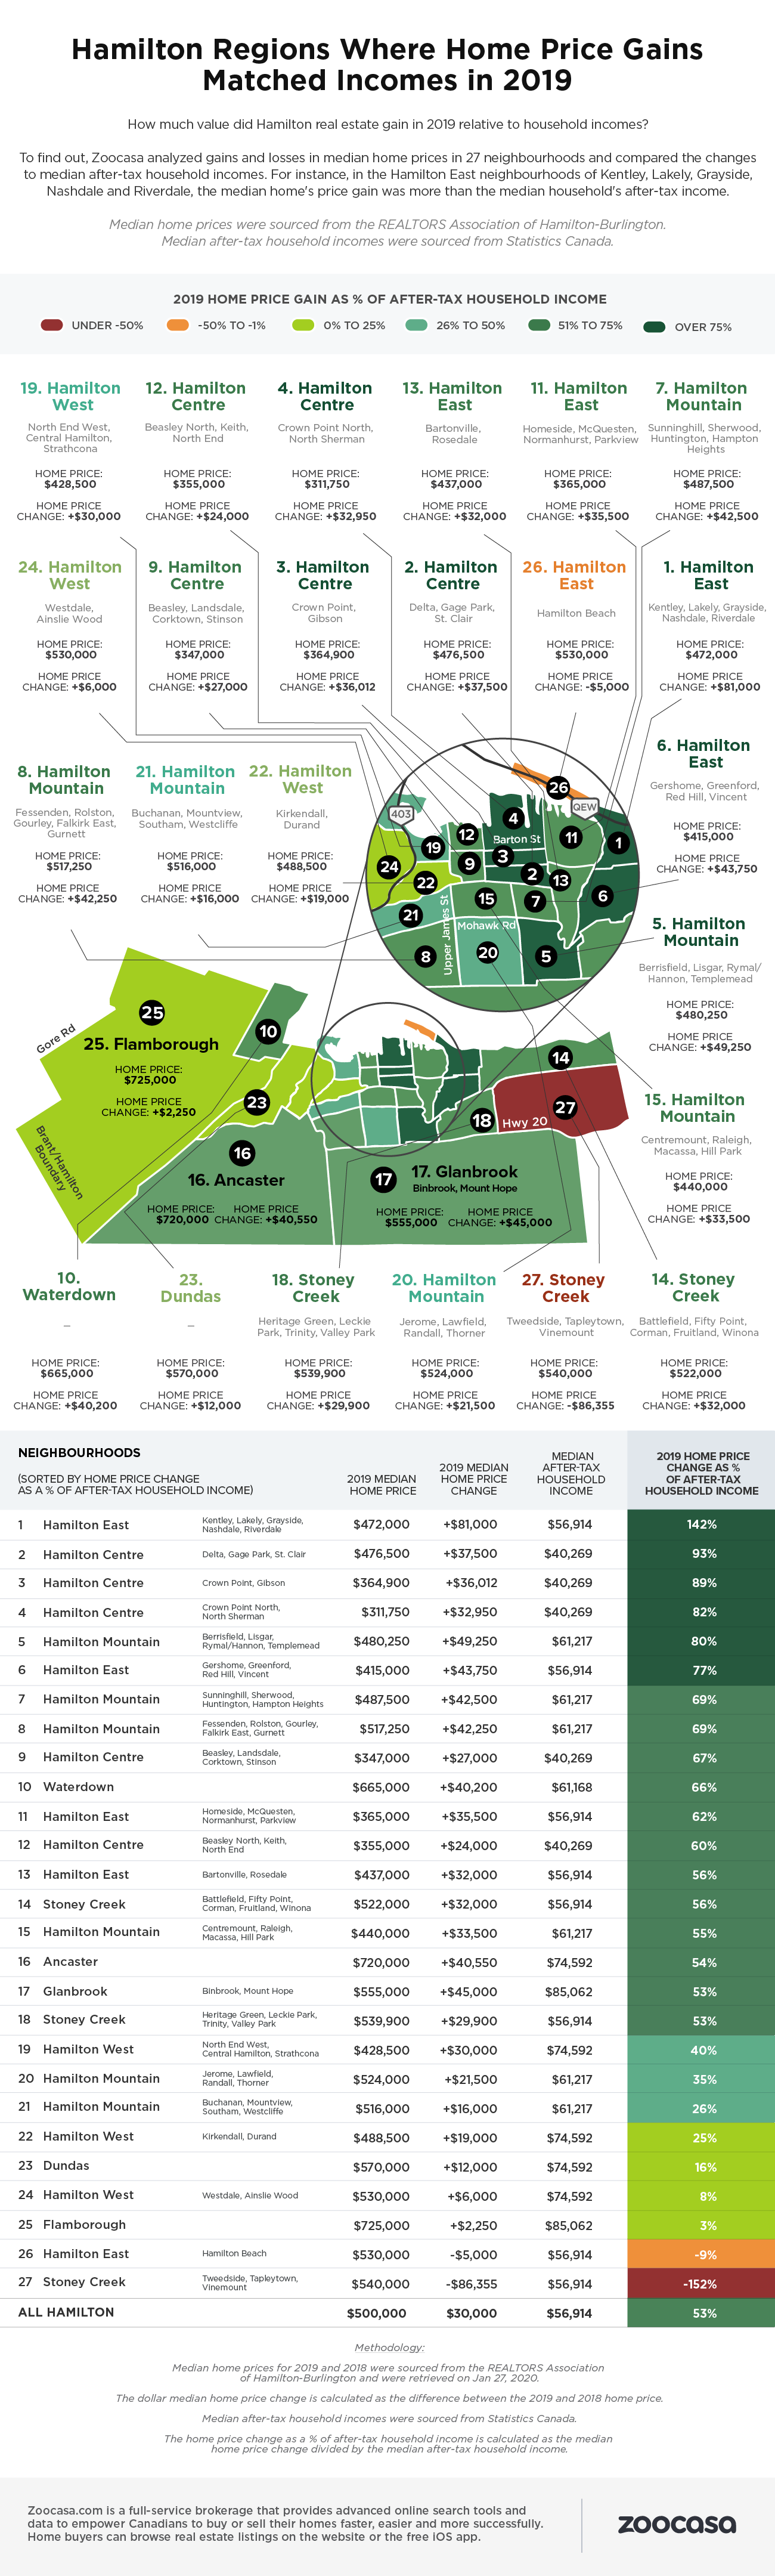
However, as seen throughout the GTA, Hamilton is experiencing a supply crunch with 4% fewer new listings brought to market. That’s contributing to rising home prices which, in some neighbourhoods, have more than outpaced median incomes. In fact, according to a recent study from Zoocasa, there are a total of six Hamilton neighbourhoods that have experienced median home price growth equivalent to 76 – 100% of local median incomes, with another 12 within in the 51 – 75% range.
The study compiled 2019 median home prices and gains in 27 Hamilton neighbourhoods, and compared them to after-tax median incomes earned in each to see how home values have increased relative to local household earnings. Median home prices were sourced from RAHB, while median after-tax incomes were sourced from Statistics Canada.
Hamilton East Neighbourhoods Experiencing Strongest Home Price Growth
According to the data, home prices located within the Hamilton East area that encompasses Kentley, Lakely, Grayside, Nashdale, and Riverdale experienced the strongest price growth in the city. There, the median home price clocked in at $472,000, a difference of $81,000 from 2018. That increase accounts for a whopping 142% of the local median after-tax income of $56,914.
The Hamilton Centre neighbourhood that includes Delta, Gage Park and St. Clair also experienced a home price increase nearly equivalent to that of incomes; homes cost $37,500 more than they did last year at a median price of $476,500, accounting for 93% of the median $40,269 earned by locals. Also in the top three are Crown Point and Gibson, located within Hamilton Centre. There, homes cost a median of $364,900,
Just Two Hamilton Neighbourhoods Experienced Price Declines
While the vast majority – 25 of 27 – of Hamilton neighbourhoods experienced home price growth in 2019, there are a couple that saw declines. The Stoney Creek neighbourhood that includes Tweedside, Tapleytown, and Vinemount experienced a decrease of $86,355, bringing the median home price down to $540,000, accounting for -152% of the median income of $56,914.
The unique neighbourhood of Hamilton Beach, which is located on a spit of land that juts into Lake Ontario adjacent to the city’s industrial areas, also saw home prices fall by $5,000 to a median of $530,000, accounting for -9% of local incomes of $56,914.
The more rural community of Flamborough, which tends to feature larger homes on spacious lots, saw the smallest gains in the city,
Check out the infographic below to see how median home prices have changed across Hamilton in 2019, and how they stack up as a percentage of local median incomes:
Methodology
Median home prices for 2019 and 2018 were sourced from the REALTORS Association of Hamilton-Burlington and were retrieved on Jan 27, 2020. The dollar median home price change is calculated as the difference between the 2019 and 2018 home price. Median after-tax household incomes were sourced from Statistics Canada. The home price change as a % of after-tax household income is calculated as the median home price change divided by the median after-tax household income. Median home prices for 2019 and 2018 were sourced from the REALTORS ASSOCIATION of Hamilton-Burlington. The dollar median home price change is calculated as the difference between 2019 and 2018 home price.
Median after-tax household incomes were sourced from Statistics Canada.
The home price change as a % of after-tax household income is calculated as the median home price change divided by the median after-tax household income.
About Zoocasa
Zoocasa is a full-service brokerage that offers advanced online search tools to empower Canadians with the data and expertise they need to make more successful real estate decisions. View real estate listings on zoocasa.com or download our free iOS app.