
The London real estate market – home to a population of over 400,000 and Ontario’s sixth-largest city – has steadily increased in popularity in recent years, leading to hot annual price growth and heated competition among buyers.
A total of 1,043 transactions occurred last month throughout the jurisdiction overseen by the London and St. Thomas Association of Realtors (LSTAR), marking a 5.4% year-over-year increase and prompting the board to declare it the “best July ever” since it started tracking the market in 1973.
Related Read: These are the most affordable London real estate markets
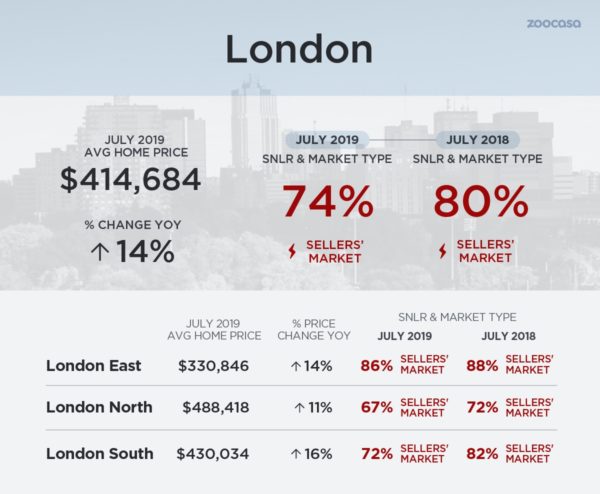
Much of this demand likely stems from the fact that condos and houses for sale in London, Ontario are comparatively more affordable than other nearby urban centres; the average home price in the City of London hit $414,684 in July, an increase of 14% year over year, yet still well below the mid-to-upper $900,000-price range for real estate in the City of Toronto. As well, a strong job market based on the education and healthcare sectors, and a well-positioned central location, have been effective in drawing buyers to the region.
In fact, home prices have been on the rise in early all of London’s local and annexed suburb markets with the majority – four out of five – considered to be sellers’ markets, according to
The study based its findings on local sales-to-new-listings ratios, a metric that helps gauge the level of buyer competition within a housing market. Calculated by dividing the number of sales by new listings over the course of the month, a range between 40 – 60% indicates a balanced market, with above and below those thresholds as sellers’ and buyers’ markets, respectively.
London is Steep Sellers’ Market
For the City of London as a whole, buyers and sellers alike have been keeping busy; the volume of July transactions rose 3.3% above last year’s level with 678 homes changing hands. However, sellers have been eager to put their MLS listings on the market, with a new supply of 912 homes put up for sale over the course of the month – a 12% increase. That’s provided prospective home buyers with more choice and has eased the city’s SNLR to 74% from 80% last year.
However, as that remains well within sellers’ market territory, prices have continued their upward trajectory, with the average home now fetching roughly $50,000 more than it would have last year.
These sizzling sellers’ conditions are reflected throughout the city’s local markets; the hottest remains in London East, where a relatively lower price point has supported steady sales and new listings growth. A total of 225 homes changed hands in the suburb in July, up 4.6%, with 262 new listings hit the market (+6.9%). While the larger increase in supply than sales has technically eased the SNLR from last year – it is now 86% compared to 88% – it remains an extremely tight market, which has pushed the average home price up 14% to $330,846 – about a $41,000 difference from July 2018.
London South is nearly as scorching with an SNLR of 72%, but it’s a quieter vibe; a total of 346 new listings have flooded the market by 15% while year-over-year sales stayed flat with 249 transactions. That’s calmed the market down from last year’s ratio of 82%, which has driven the average home price up by 16% to $430,023 – difference of about $60,000.
Buyers in London North will find a similar scenario as the market remains firmly in sellers’ territory with a ratio of 67%, down from 72% last year. While sales have risen 5% year over year with 204 sold, a 13% increase in new listings has provided buyers with greater supply and cooled the chance of bidding wars. However, home prices are still on the up, hitting $488,418, an increase of 11% and about $46,000 year over year.
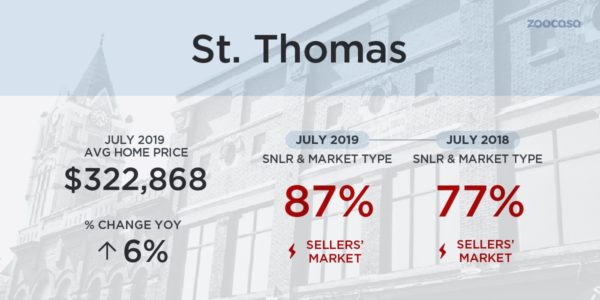
Fewer Homes Listed in St. Thomas
While an overall smaller market with just 73 sales – five fewer than last year, marking a decline of -6% – the level of competition has increased in St. Thomas due to a retraction in supply; just 84 homes were listed for sale over the course of the month, down -17% from last year. That’s driven the local SNLR to 87% from 77% last year, and the average home price up 6% to $322,868 (+$18,000).
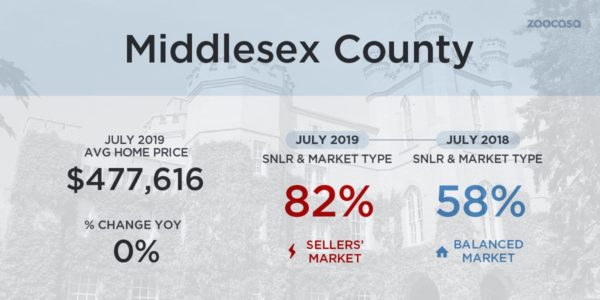
Middlesex Market in Supply Crunch
Another similarly-sized market, Middlesex County saw 99 homes change hands, an increase of 29 transactions marking a 49% increase. That’s well outpaced flat new listings growth, driving the SNLR to 82%, and bringing the market officially into sellers’ territory from the balance it enjoyed last year. Home prices, however, have yet to catch up remaining relatively stable at $477,616 (+0.8%).
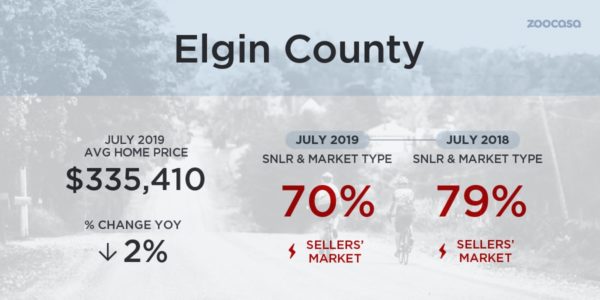
More Choice in Elgin County
Elgin County experienced a 38% increase in sales with 76 transactions, and a whopping 55% increase in new listings; that’s effectively lowered its SNLR to 70% from 79% last year, pushing the average price down -2% to $335,410.
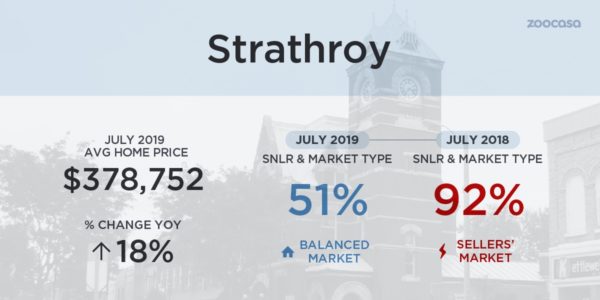
Strathroy Only Balanced Market in Region
A predominantly rural market, sales trends in Strathroy can be more volatile due to lower overall supply and pace of transactions. Sales fell -19% from 2018 with 29 sold, outpaced by a 46% increase in new listings as 57 hit the market. That’s made Strathroy the only balanced market of the bunch with an SNLR of 51%, down considerably from 92% last July. However, the average home price still rose a robust 18% to $378,752, about $57,000 more.
METHODOLOGY
The sales-to-new-listings ratio (SNLR) is calculated as sales divided by new listings. Home prices, sales and new listings were sourced from the London St. Thomas Association of Realtors.
About Zoocasa
Zoocasa.com is a real estate website that provides advanced online search tools and data to empower Canadians to buy or sell their homes faster, easier and more successfully. Home buyers can browse real estate listings on the website or the free iOS app.
For more information about this report or to set up a media interview, please email [email protected].