The real estate market in the Greater Toronto Area (GTA) continued on an upward trajectory this summer, with August 2020 hitting a second month of record breaking sales following a slow spring market.
With low borrowing costs, and improving economic conditions, GTA buyers jumped back into the market, albeit with a renewed look at their housing priorities. With more people spending the majority of their time at home over the past few months, some buyers are now seeking out larger properties with backyards or better access to green space, resulting in a shift in housing demand to municipalities where this format of low-rise housing is typically more accessible and available.
Using the latest available monthly data from the Toronto Regional Real Estate Board (TRREB) for August, Zoocasa reviewed average detached house price trends in 33 GTA municipalities or regions. Our analysis showed that there was a significant rise in average detached home prices across several Toronto regions, with a number of cities hitting their peak average detached price, or close to it, last month. In regions where the average home price did not hit its peak in August, Zoocasa calculated how far from the peak the August average price was in dollar value and percentage terms. For regions with fewer than 20 sales, Zoocasa did not calculate the percentage change, as a low transaction volume and the possibility of exceptional sales can skew average price data.
Our report provides a top-level review of home price trends for detached properties in GTA municipalities. While this data provides directional perspective, prospective home buyers should conduct a detailed pricing analysis for properties that match their needs in the neighbourhoods they desire to better guide their next steps.
12 GTA Municipalities Saw Record-Breaking Average Home Prices for Detached Properties in August
Of the 33 GTA areas included in our analysis, average home prices hit their all-time peak in 12 regions.
At the regional level, both Durham Region ($813,740) and Halton Region ($1,283,651) noted average home prices for detached properties at their peak in August. Peel Region was close behind, with the average detached home prices at $1,112,634 – just $2,195 shy of the peak which was last month. While the Peel region as a whole did not reach a new average price high, both Brampton ($989,039) and Mississauga ($1,307,832) noted their highest average home price on record for detached properties.
In Durham Region, 5 of 8 municipalities saw detached house prices reach their highest levels. Detached home prices hit a peak in Ajax ($862,454), Clarington ($732,523), Oshawa ($672,522), Scugog ($919,542) and Whitby ($886,322). Brock and Pickering each noted their third highest average monthly price on record, while Uxbridge was the only Durham Region municipality that did not see average home prices at their peak or close to it.
Every municipality in Halton Region noted an average detached home price at or near its peak in August 2020. In Burlington ($1,184,945) and Halton Hills ($1,046,213), average prices hit their highest levels on record, while Milton ($1,044,360) saw prices $7,603 lower than the July record price. Oakville recorded its third highest average home price for detached properties at $1,582,531 in August.
In total, 18 municipalities across the GTA noted average home prices above the million dollar mark in August, compared to 12 regions this time last year. These municipalities were concentrated in the City of Toronto, Durham Region, Halton Region, Peel Region and York Region.
York Region Average Detached Prices Down 11% From 2017 Peak
Despite 8 of 9 municipalities recording detached average home prices above the $1,000,000 mark, not a single York Region municipality saw average home prices hit close to a peak in August. In fact, for the region as a whole, the average home price was down $157,806 (-11%) from the peak price of $1,466,236 in February 2017.
At the municipality-level, prices were down over $100,000 or in double digit percentage figures in every area that recorded a million dollar plus detached average home price, and all of these regions except for King, hit their peak average home price in the spring of 2017. Georgina remains the only region with a sub-million dollar average home price for detached properties at $731,183, which is 5% or $35,090 lower than the peak price in May 2017. In King, the average home price in August noted the starkest difference from it’s October 2016 peak; down 22% or a whopping $503,375 to $1,774,480.
Following King, Richmond Hill noted the steepest decline in the average home price since the peak in April 2017, dropping 17% or $320,893 to $1,563,178. Rounding out the York Region municipalities with the largest average detached home price drops were Markham ($1,465,417) and Aurora ($1,259,424), where prices declined 15% since their respective spring 2017 peaks.
City of Toronto Detached Home Prices 5% Lower Than 2017 Peak
For the City of Toronto as a whole, the average detached home price of $1,505,100 in August was $73,442 or 5% lower than the peak price in April 2017. While detached average home prices were above the $2,000,000 mark in Toronto Central this August, this figure was still 5% or $117,910 lower than the February 2017 peak price. Toronto West followed a similar pattern, with average detached home prices $113,956 or 8% lower than the peak, however, this record price was much more recent, in June 2020.
Toronto East is the only region in the City of Toronto that saw prices stay flat since their July 2020 peak. The average detached home price in the area this August was $1,118,506, which was $3,559 lower than last month. August marked the area’s third highest average detached home price on record.
Our infographic below maps average monthly detached prices for August for each region included in our analysis, noting which regions saw home prices hitting new highs, or alternatively how far from the peak the current average home price is.
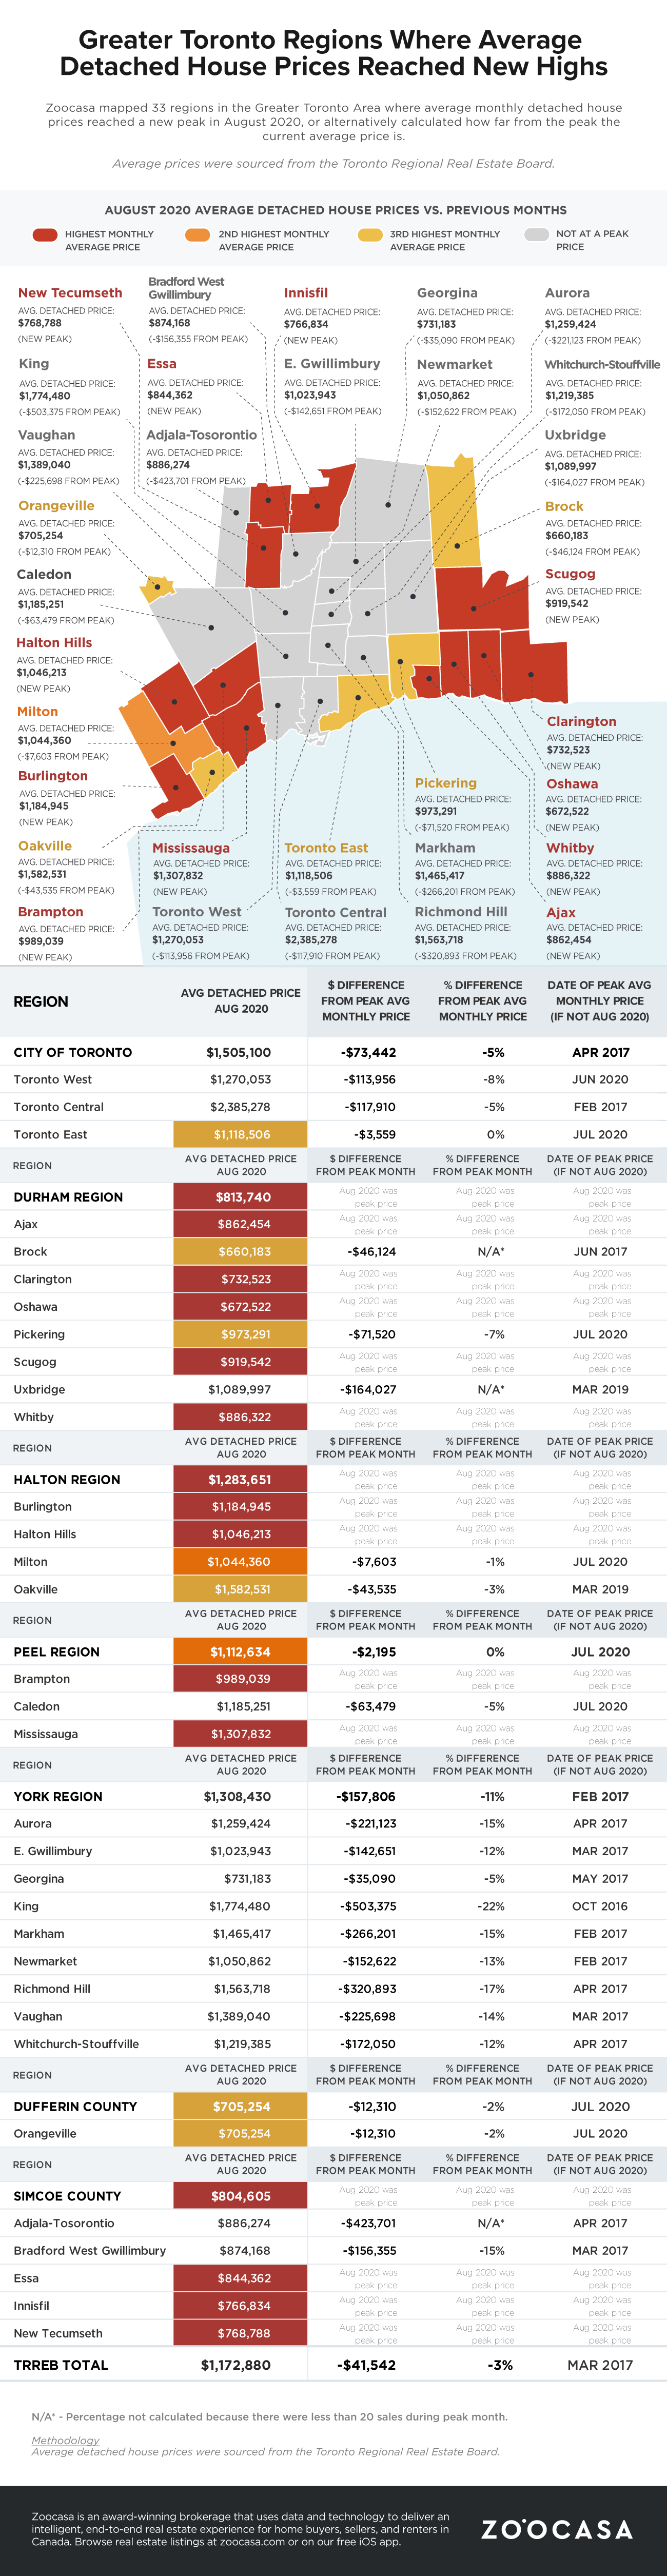
Table of Greater Toronto Region Average Detached Home Prices (Aug 2020)
| Region | Avg. Detached Price (Aug 2020) | Difference from Peak Avg. ($) | Difference from Peak Avg. (%) | Date of Peak Avg. Price |
|---|---|---|---|---|
| CITY OF TORONTO | $1,505,100 | -$73,442 | -5% | Apr 2017 |
| Toronto West | $1,270,053 | -$113,956 | -8% | Jun 2020 |
| Toronto Central | $2,385,278 | -$117,910 | -5% | Feb 2017 |
| Toronto East | $1,118,506 | -$3,559 | 0% | Jul 2020 |
| DURHAM REGION | $813,740 | Aug 2020 was peak price | Aug 2020 was peak price | Aug 2020 was peak price |
| Ajax | $862,454 | Aug 2020 was peak price | Aug 2020 was peak price | Aug 2020 was peak price |
| Brock | $660,183 | -$46,124 | N/A* | Jun 2017 |
| Clarington | $732,523 | Aug 2020 was peak price | Aug 2020 was peak price | Aug 2020 was peak price |
| Oshawa | $672,522 | Aug 2020 was peak price | Aug 2020 was peak price | Aug 2020 was peak price |
| Pickering | $973,291 | -$71,520 | -7% | Jul 2020 |
| Scugog | $919,542 | Aug 2020 was peak price | Aug 2020 was peak price | Aug 2020 was peak price |
| Uxbridge | $1,089,997 | -$164,027 | N/A* | Mar 2019 |
| Whitby | $886,322 | Aug 2020 was peak price | Aug 2020 was peak price | Aug 2020 was peak price |
| HALTON REGION | $1,283,651 | Aug 2020 was peak price | Aug 2020 was peak price | Aug 2020 was peak price |
| Burlington | $1,184,945 | Aug 2020 was peak price | Aug 2020 was peak price | Aug 2020 was peak price |
| Halton Hills | $1,046,213 | Aug 2020 was peak price | Aug 2020 was peak price | Aug 2020 was peak price |
| Milton | $1,044,360 | -$7,603 | -1% | Jul 2020 |
| Oakville | $1,582,531 | -$43,535 | -3% | Mar 2019 |
| PEEL REGION | $1,112,634 | -$2,195 | 0% | Jul 2020 |
| Brampton | $989,039 | Aug 2020 was peak price | Aug 2020 was peak price | Aug 2020 was peak price |
| Caledon | $1,185,251 | -$63,479 | -5% | Jul 2020 |
| Mississauga | $1,307,832 | Aug 2020 was peak price | Aug 2020 was peak price | Aug 2020 was peak price |
| YORK REGION | $1,308,430 | -$157,806 | -11% | Feb 2017 |
| Aurora | $1,259,424 | -$221,123 | -15% | Apr 2017 |
| E. Gwillimbury | $1,023,943 | -$142,651 | -12% | Mar 2017 |
| Georgina | $731,183 | -$35,090 | -5% | May 2017 |
| King | $1,774,480 | -$503,375 | -22% | Oct 2016 |
| Markham | $1,465,417 | -$266,201 | -15% | Feb 2017 |
| Newmarket | $1,050,862 | -$152,622 | -13% | Feb 2017 |
| Richmond Hill | $1,563,718 | -$320,893 | -17% | Apr 2017 |
| Vaughan | $1,389,040 | -$225,698 | -14% | Mar 2017 |
| Whitchurch-Stouffville | $1,219,385 | -$172,050 | -12% | Apr 2017 |
| DUFFERIN COUNTY | $705,254 | -$12,310 | -2% | Jul 2020 |
| Orangeville | $705,254 | -$12,310 | -2% | Jul 2020 |
| SIMCOE COUNTY | $804,605 | Aug 2020 was peak price | Aug 2020 was peak price | Aug 2020 was peak price |
| Adjala-Tosorontio | $886,274 | -$423,701 | N/A* | Apr 2017 |
| Bradford West Gwillimbury | $874,168 | -$156,355 | -15% | Mar 2017 |
| Essa | $844,362 | Aug 2020 was peak price | Aug 2020 was peak price | Aug 2020 was peak price |
| Innisfil | $766,834 | Aug 2020 was peak price | Aug 2020 was peak price | Aug 2020 was peak price |
| New Tecumseth | $768,788 | Aug 2020 was peak price | Aug 2020 was peak price | Aug 2020 was peak price |
| TRREB TOTAL | $1,172,880 | -$41,542 | -3% | Mar 2017 |
Source and Methodology
Monthly average prices were sourced from the Toronto Regional Real Estate Board. For areas with lower number of sales per month, the average sold price can fluctuate due to the small volume and the ability for a few exceptional transactions (very high or very low prices compared to the other transactions) to skew the average.
Contact
For more information about this report or to set up a media interview, please contact communications@zoocasa.com