
This February, the Greater Toronto Area housing market is showing mixed signals, but the main story is about sellers, not buyers. New listings dropped 17.7% from last year, falling from 13,004 in February 2025 to 10,705 in February 2026. This drop is much steeper than the 6.3% decrease in sales (3,868 transactions), so the market is tightening because fewer homes are being listed, not because demand is rising.
The trend aligns with recent Ipsos polling data showing that listing intentions for 2026 are down. “Many would-be homebuyers are waiting for selling prices to level off before moving into the market. If new listings continue to trend lower through the spring, competition between homebuyers will increase, supporting home prices and a recovery in sales,” said TRREB President Daniel Steinfeld.
The average selling was $1,008,968, which is 7.1% lower than in February 2025. After adjusting for seasonality, both prices and sales also declined relative to January 2026, suggesting the market may not yet have reached its lowest point.

Over 100,000 Buyers Are Waiting on the Sidelines
Despite the dip in sales, TRREB’s data points to a significant pool of pent-up demand. According to TRREB Chief Information Officer Jason Mercer, more than 100,000 buyers are currently holding off on home purchases. These buyers are waiting for two things: selling prices to level off and positive news on the trade front.
“Once we see both, there could be substantial momentum driving home sales in the second half of this year and into 2027,” said Mercer.
This waiting is keeping sales low for now, but the market could change quickly once buyers feel more confident. If new listings keep dropping and those waiting buyers start to act, competition could heat up, especially in areas where there aren’t many homes for sale.
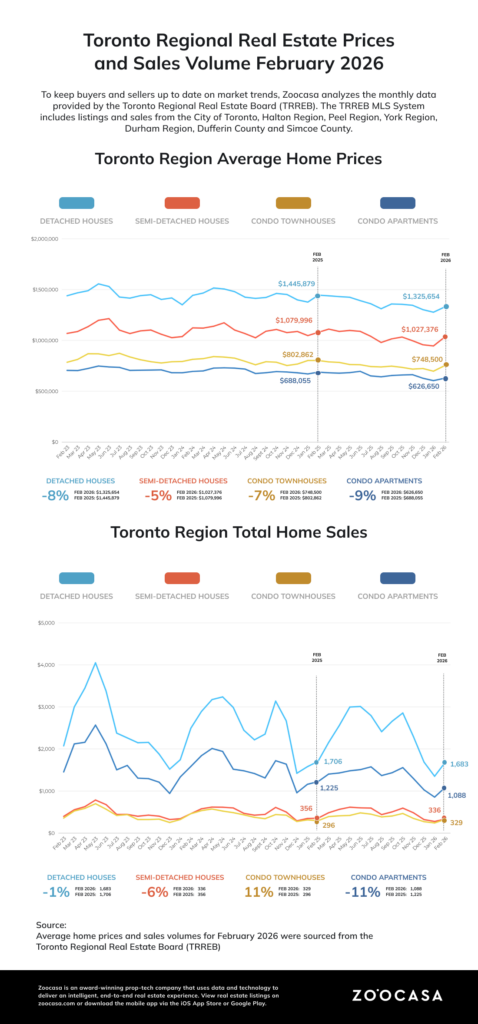
Detached Homes See Modest Sales Activity, Sharper Price Drops
Detached homes made up 43.5% of all sales in February, with 1,683 transactions, and they still lead the market. However, their prices are dropping faster than those of other home types. The average price for a detached home in the GTA fell 8.2% from last year to $1,325,654. In the 416 area, prices dropped even more, down 11.4% to an average of $1,568,543.
In the 905, detached home prices fell 7.5% to $1,240,467. Even with these price changes, the number of sales remained fairly steady. In fact, detached home sales in the 416 area were up 3.6% compared to last year, suggesting that lower prices are attracting some buyers back to the market.
Condos Continue to Struggle as Inventory Piles Up
Condo apartments are facing the most challenges right now. Only 1,088 condos sold across all TRREB regions in February, which is a 12.0% drop from last year—the biggest decline among all home types. In the 416 area, condo sales fell 12.3%, and in the 905 area, they dropped 11.5%.
Condo prices also dipped. The average condo price across the GTA was $626,650, down 8.8% from last year. In Toronto, condo prices fell 8.1% to $663,984, while in the 905 area, they declined 10.1% to $549,563. There were 4,529 active condo listings in Toronto, but only 733 sales, so this segment is still very much a buyer’s market.
For buyers who can’t afford detached or semi-detached homes, condos offer many options. Most condos sold in February were priced between $400,000 and $599,999, making this the most affordable segment of the GTA market.
Semi-Detached and Townhouses: A Mixed Bag
There were 336 semi-detached home sales across the GTA, with an average price of $1,027,376, which is a 5.8% drop from last year. In the 416 area, prices for semi-detached homes fell 4.6% to $1,229,853. In the 905 area, prices dropped even more, down 8.7% to $864,088.
Townhouse sales followed a similar trend, with 698 sold in total. The average price across the GTA was $844,862, down 7.2% from last year. In the 416 area, prices dropped 4.6% to $980,175, and in the 905 area, they fell 8.2% to $806,876. Interestingly, townhouse sales in the 416 went up by 2.7%, while sales in the 905 dropped 3.7%. This suggests buyers are still interested in mid-priced urban homes.
The “Missing Middle” Is Still Missing
TRREB CEO John DiMichele is pushing for more “missing middle” housing, including semis, townhouses, and low-rise apartment buildings, to give buyers more options between condos and detached homes. Right now, not enough mid-range homes are being built, and TRREB is calling on the federal and provincial governments to help change that. Without more supply, buyers in the GTA are stuck choosing between a $626,650 condo and a $1,325,654 detached home, with very little in between.
Homes Are Sitting Longer
Homes are taking longer to sell. The average Listing Days on Market (LDOM) went up to 36 days from 27 last February, a 33.3% increase. Property Days on Market (PDOM) also rose to 54 days, up 28.6% from 42 last year. This shows that buyers are moving more slowly and using the higher inventory and lower prices to negotiate better deals.
Brampton, Mississauga, and Markham Lead Suburban Sales
Outside Toronto, Mississauga led with 345 sales at an average price of $963,747. Brampton was close behind with 309 sales, averaging $887,457 per sale. Markham was third with 182 sales, but its average price was much higher at $1,068,928.
Brampton remains popular with buyers seeking more affordable options, with prices almost $120,000 below the GTA average. Mississauga has a wider variety of homes, including many condos, which helps keep its average price under $1 million. Markham’s higher prices are due to its many detached and semi-detached homes in well-established neighborhoods.
Peel and York regions accounted for 1,389 of the 2,377 sales outside Toronto, indicating that most suburban demand in the GTA is concentrated in these two areas.
Here’s a look at how listings, sales, and inventory changed from last month across GTA markets.
City of Toronto: Buyer’s Market
- New Listings: 4,035 (-1.0% m-o-m)
- Sales: 1,491 (+38.8% m-o-m)
- Active Listings: 7,397 (+6.2% m-o-m)
- Months of Inventory: 5.0 (0% m-o-m)
Peel Region: Buyer’s Market
- New Listings: 1,966 (-4.9% m-o-m)
- Sales: 706 (+15.9% m-o-m)
- Active Listings: 3,628 (+5.0% m-o-m)
- Months of Inventory: 5.5 (0% m-o-m)
York Region: Buyer’s Market
- New Listings: 1,959 (-1.9% m-o-m)
- Sales: 683 (+23.3% m-o-m)
- Active Listings: 3,704 (+7.1% m-o-m)
- Months of Inventory: 5.5 (0% m-o-m)
Halton Region: Balanced Market
- New Listings: 1,158 (+3.3% m-o-m)
- Sales: 397 (+21.8% m-o-m)
- Active Listings: 2,018 (+13.7% m-o-m)
- Months of Inventory: 4.6 (0% m-o-m)
Durham Region: Seller’s Market
- New Listings: 1,129 (+4.2% m-o-m)
- Sales: 454 (+10.2% m-o-m)
- Active Listings: 1,650 (+13.9% m-o-m)
- Months of Inventory: 3.5 (+2.9% m-o-m)
Planning your next move? Zoocasa can help you find properties that fit your lifestyle and your budget. Start your search today.