
Out of the housing markets in Ontario’s Greater Golden Horseshoe, Kitchener-Waterloo stands out as one of the region’s hottest; despite a slight slowing in August sales (down 9.1% year over year), sales-to-new-listings activity remains steep, creating an increasingly competitive marketplace for prospective buyers, setting the stage for an active fall market.
One of the area’s main draws is its relatively well-priced housing stock, especially compared to Toronto homes for sale: the average detached house can be purchased for $615,568 – less than the average condo unit in the City of Toronto, which now fetches an average of $619,307. This makes the city a popular real estate destination for both locals and buyers on the move, whose buying power is supported by its strong education- and health-based jobs market.
Buyer Competition is Heating Up in Kitchener-Waterloo
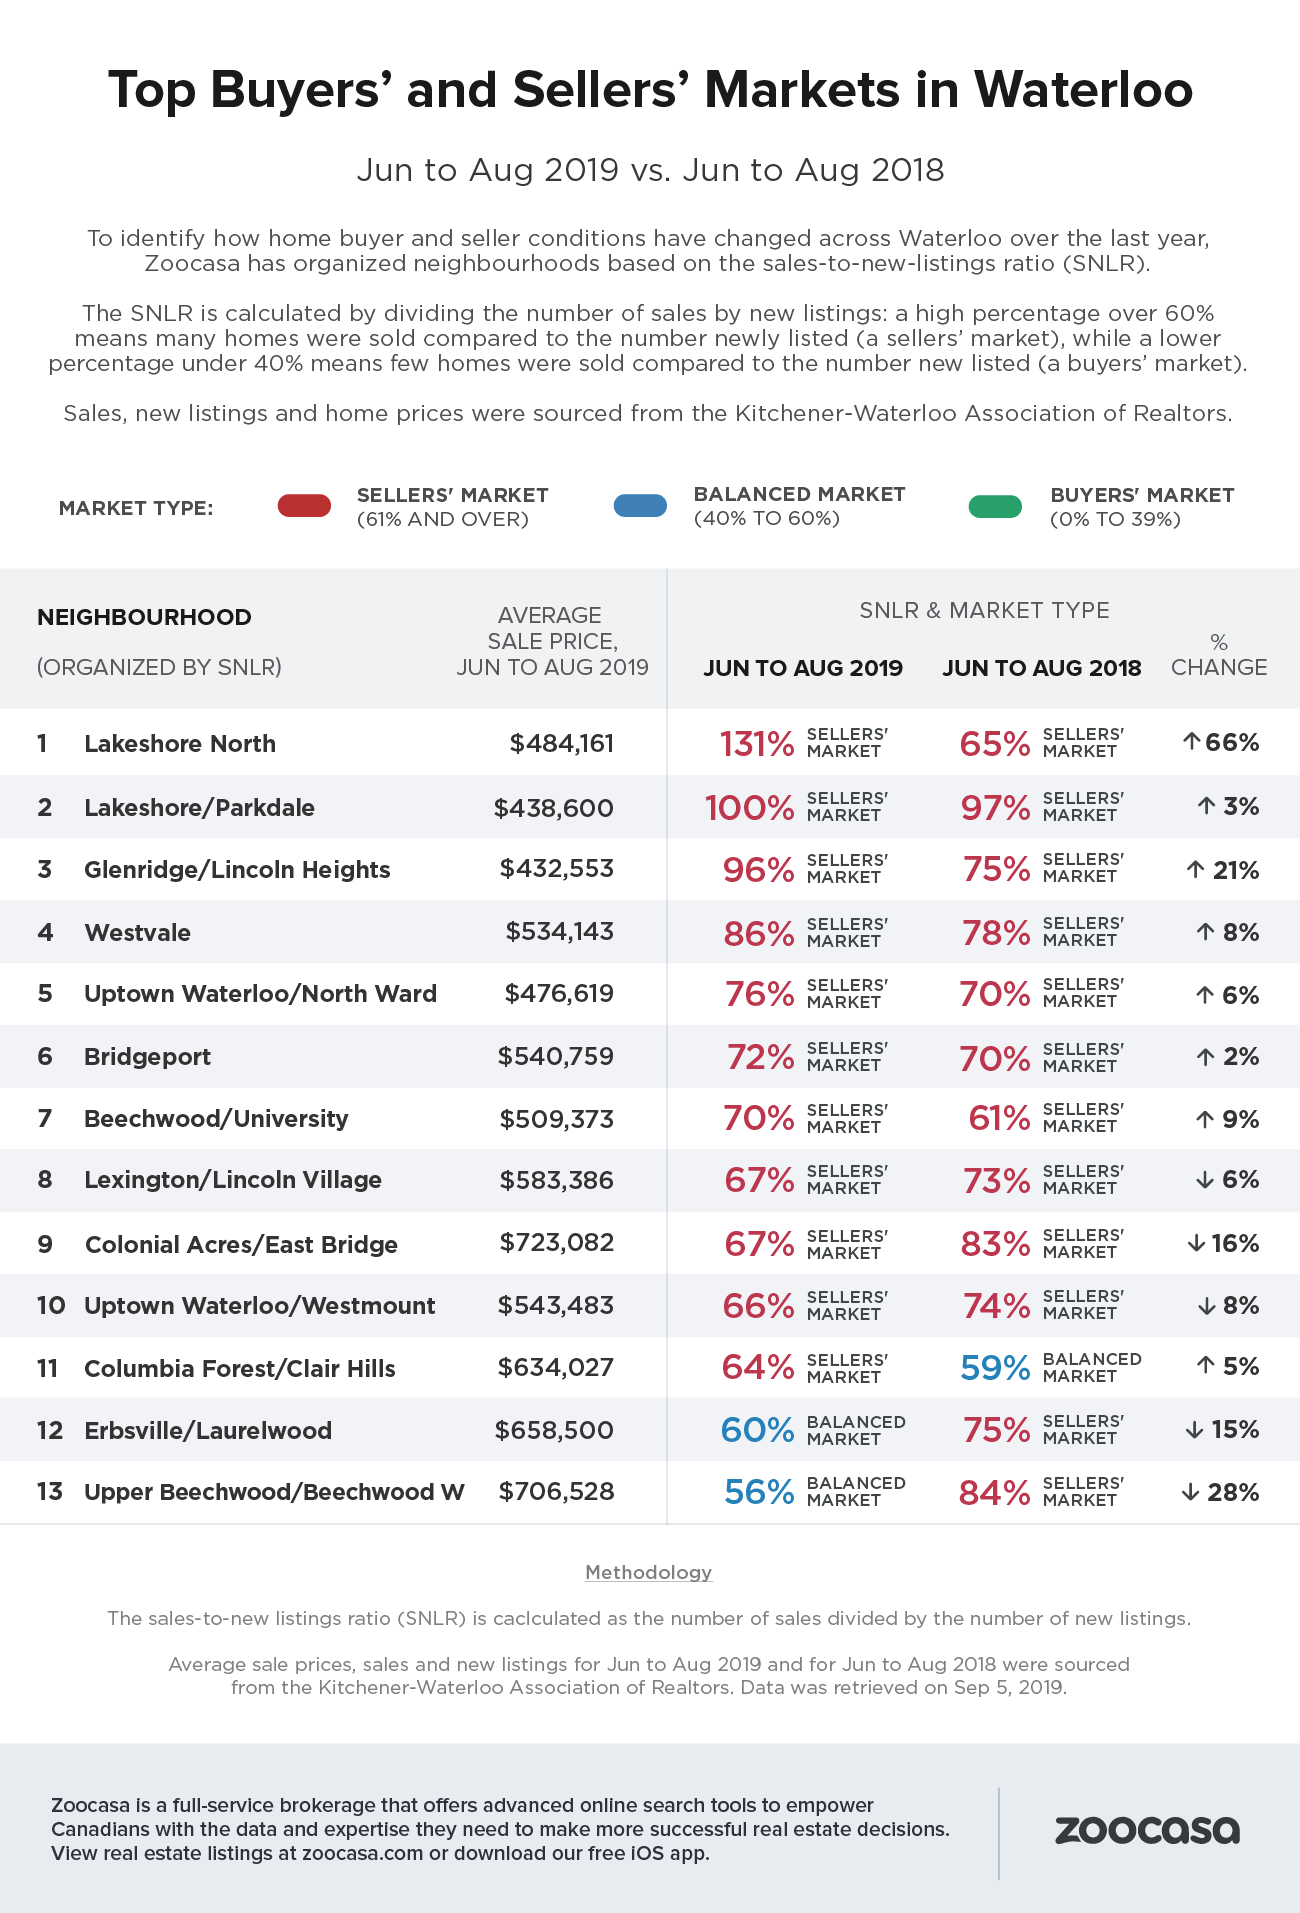
According to recent analysis by Zoocasa, sellers’ market conditions are especially strong for homes below the $600,000 range, which is exacerbated by declining new supply in some neighbourhoods. The study assessed 13 neighbourhoods across the Waterloo region, and 19 across Kitchener, based on their sales-to-new-listings ratios (SNLR) between July and August, 2019.
This ratio is calculated by dividing the number of sales by the number of new listings brought to market over the course of the month. A percentage between 40 – 60% indicates a market is balanced, while below and above that threshold reveal buyers’ and sellers’ markets.
No Buyers’ Markets Available in Waterloo
Buyer conditions were searing in the 13 neighbourhoods analyzed within the Waterloo region, as available new listings were well outweighed by sales activity, creating a very competitive environment for interested buyers. Eleven neighbourhoods have sales-to-new-listings ratios at or above the 61% mark, indicating sellers’ conditions, while only two – Erbsville / Laurelwood and Upper Beechwood – can be considered balanced, with ratios of 60% and 56%, respectively.
The neighbourhood with the highest SNLR is Lakeshore North, with a percentage of 131%, a year-over-year increase of 66%. That’s based on a 54% uptick in sales, while new listings have plunged by -23%, leading to a supply-and-demand imbalance. However, the neighbourhood remains affordable with the average price actually decreasing by 6% from 2018, to $484,161.
While market conditions haven’t increased as rapidly in Lakeshore / Parkdale, the neighbourhood has an SNLR of 100%, up 3% from last year, due to a 6% increase in sales outpacing a 3% increase in MLS listings. Prices in the area have remained fairly stable, up 2% to $438,600.
Rounding out the top three is the neighbourhood of Glenridge / Lincoln Heights with an SNLR of 96%. Here, it’s another classic supply-and-demand imbalance, as sales have surged 15% from the same time period in 2018, and new listings have fallen by -9.8%. However, this hasn’t yet had a dramatic upward pull on
Marcia Fukudome, a Zoocasa sales representative in the Kitchener-Waterloo region expects homes listed under $500,000 to be especially popular with buyers this fall. “The recently unveiled First-Time Home Buyer Incentive along with slowing mortgage rates will make homes in this area more affordable and attractive to first-time
Check out which Waterloo neighbourhoods can be considered sellers’ markets in the infographic below:
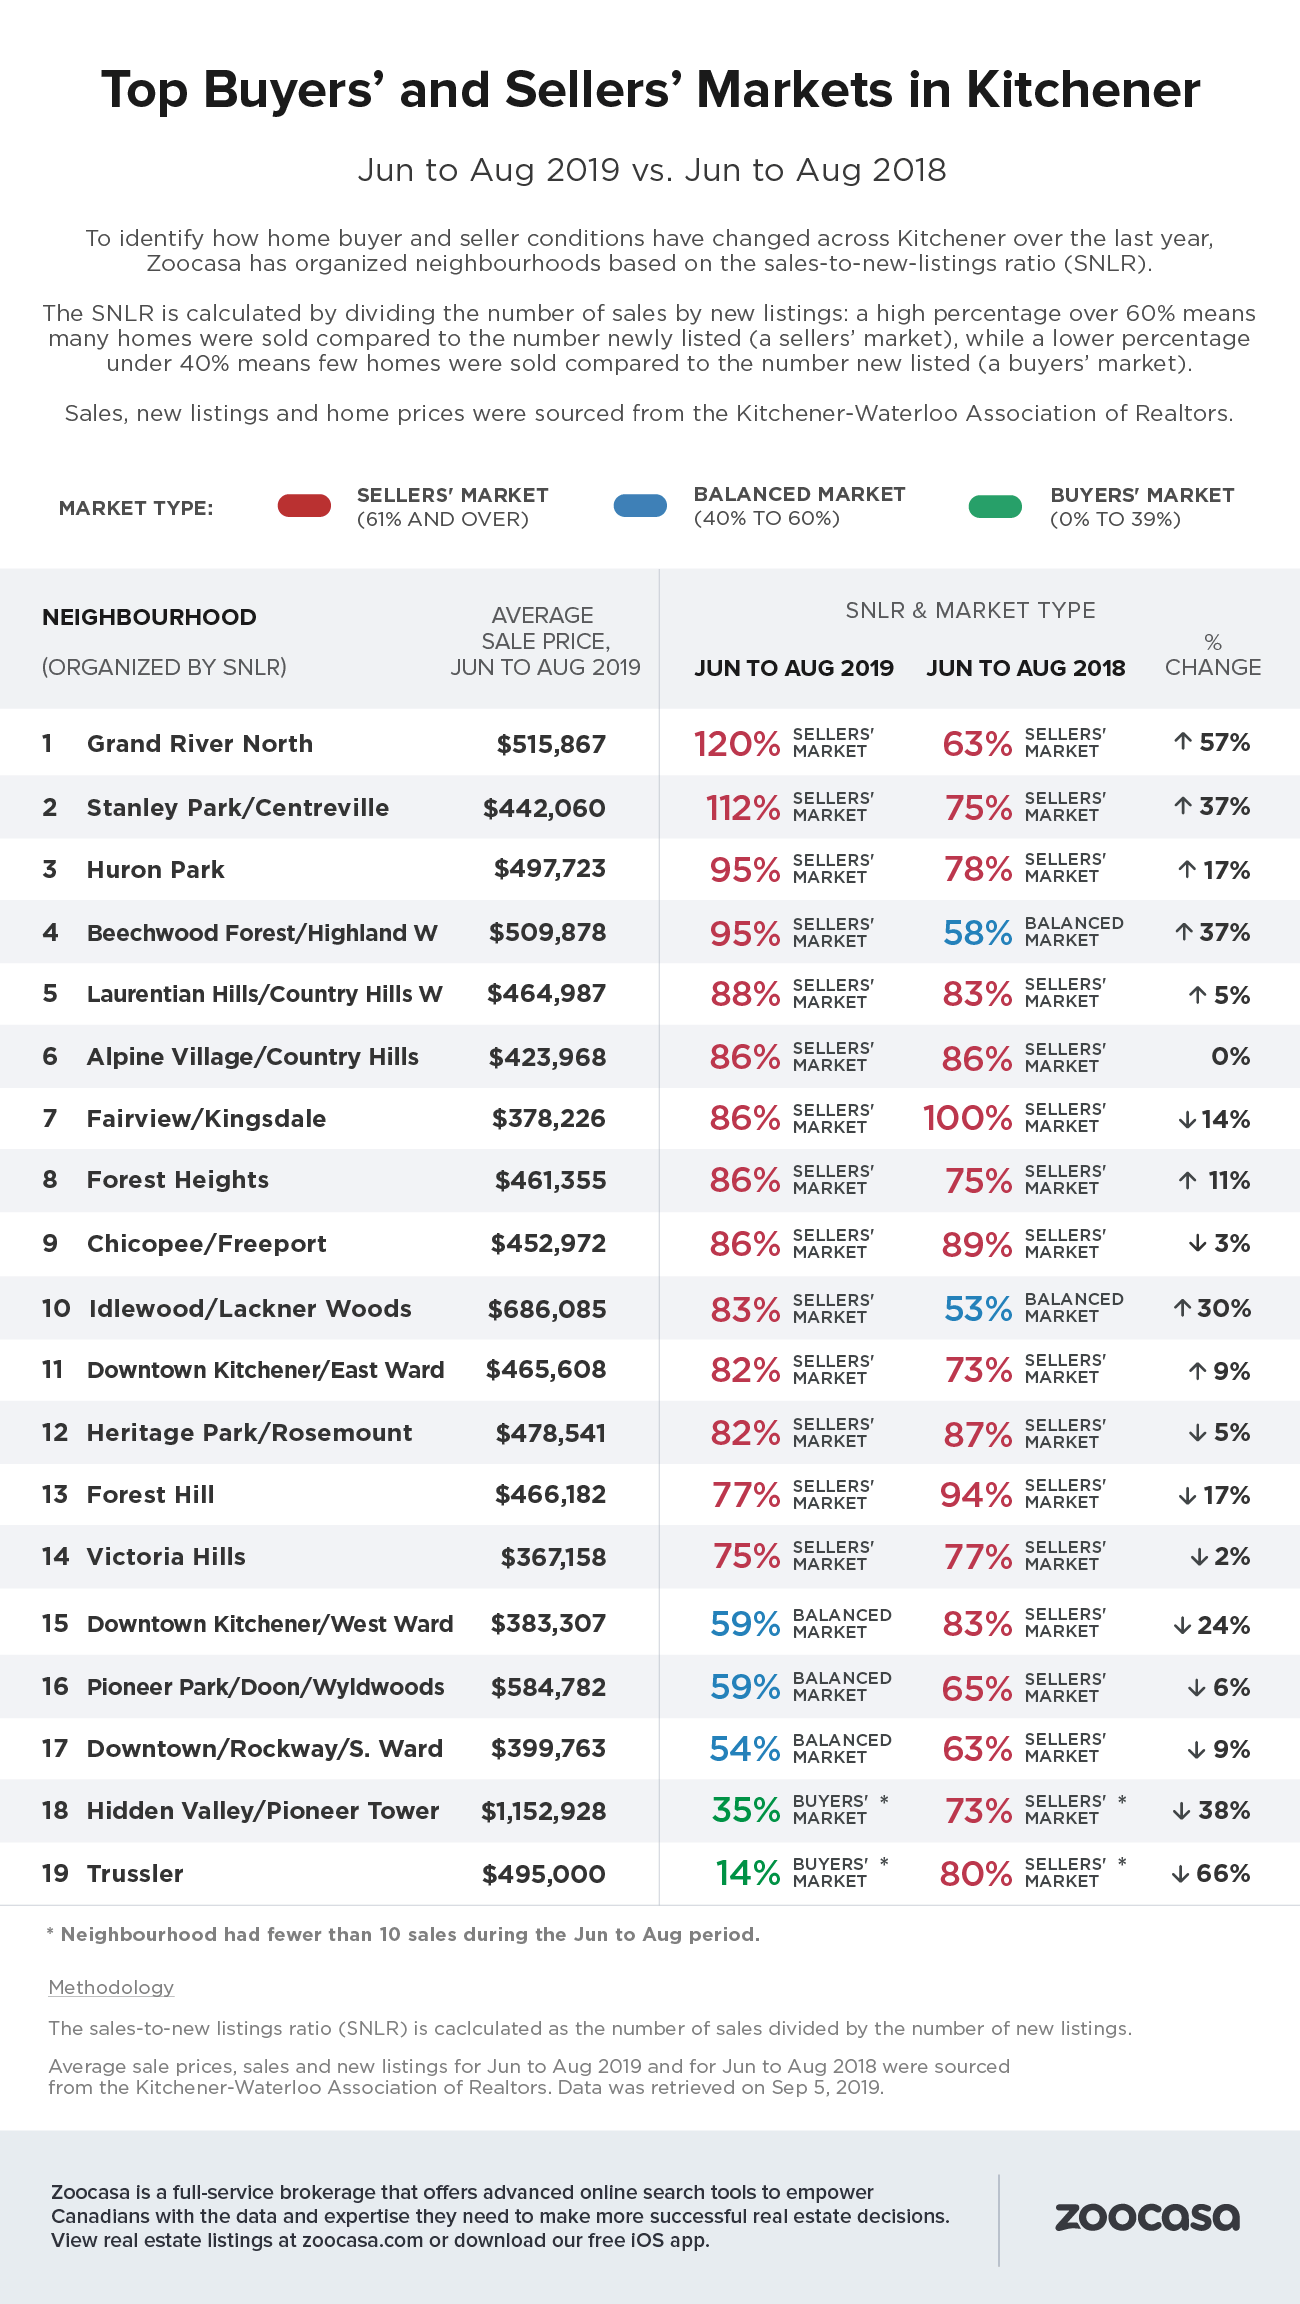
Majority of Kitchener Remains in Sellers’ Market
Of the 19 Kitchener neighbourhoods assessed by the study, the vast majority – 14 – can be considered sellers’ markets with an SNLR of 61% or more. However, three can be considered balanced – Downtown Kitchener / Westward, Pioneer Park / Doon / Wyldwoods, and Downtown / Rockway / S. Ward – with SNLRS of 59%, 59%, and 54%, respectively.
Just two – Hidden Valley / Pioneer Tower, and Trussler – can actually be considered buyers’ markets, with percentages of 35% and 14%. However, there are a few factors at play that make these neighbourhoods outliers. As Kitchener’s highest-priced neighbourhood at an average of $1,152,928, Hidden Valley has a niche luxury buyer pool, with just seven sales outpaced by 11 new listings brought to market in July and August. While Tussler is a much more affordable locale with an average price of $495,000, there is very little sales activity; just one transaction occurred between the two-month time frame, while just five new listings came to market.
Of Kitchener’s sellers’ markets, Grand River North leads the pack with an SNLR of 120%, up 57% from the year before. This reflects a 20% increase in sales while new listings have plunged -37.5%, while the average price has stayed flat at $515,867 (+1.8%).
That’s followed by Stanley Park / Centreville with a ratio of 112% (37%). Here, both sales and new listings have taken a tumble, down -12.5% and -39%. While this indicates the neighbourhood market is slowing, a deeper decline in new listings has kept choice scarce for buyers, propping the average price up by 20% to $442,060. Huron Park rounds out the top three Kitchener sellers’ markets with an SNLR of 95%, as sales and listings are both up strongly, increasing 56% and 29% year over year, pushing the average price by 11% to $497,723.
However, according to Fukudome, Kitchener still presents the best opportunities for both first-time buyers and investors, given its relative affordability.
Check out which Kitchener neighbourhoods can be considered sellers’ markets in the infographic below:
Methodology
The sales-to-new listings ratio (SNLR) is caclculated as the number of sales divided by the number of new listings.
Average sale prices, sales and new listings for Jun to Aug 2019 and for Jun to Aug 2018 were sourced
from the Kitchener-Waterloo Association of Realtors. Data was retrieved on Sep 5, 2019.
About Zoocasa
Zoocasa is a full-service brokerage that offers advanced online search tools to empower Canadians with the data and expertise they need to make more successful real estate decisions. View real estate listings at zoocasa.com or download our free iOS app.
For more information about this report or to set up a media interview, please email [email protected].