The latest monthly statistics released by the Canadian Real Estate Association (CREA) for June highlighted that home sales and new listings rebounded to normal levels across Canada last month, following a period of historic lows this April and May due to the pandemic. Almost 1 million jobs were added back to the Canadian economy in June, and the housing market showed signs of growing “cautious optimism” among buyers and sellers, as CREA noted.
Further, as July 1 approached, recently announced changes to the Canada Mortgage and Housing Corporation (CMHC) mortgage insurance borrowing criteria loomed, which may have incentivized certain buyer segments to accelerate their search. As such, national home sales improved 63% since May, and there was a 49.5% monthly spike in new listings. Average home prices rose 6.5% nationally year-over-year (y-o-y) to almost $539,000 in June.
A closer look at real estate markets across Ontario for June revealed that regional market trends closely mirrored national housing activity. After all, Ontario accounted for 378,000 of the total jobs recovered in June, and much of the province graduated into Stage 2 of reopening by the end of the month. To get a gauge on how the pandemic impacted price and sales activity in Ontario, Zoocasa reviewed average home prices and sales data for June from local real estate boards and CREA for 28 Ontario markets, comparing changes on an annual basis to highlight how and where the market shifted since last year.
Our analysis and findings provide a bird’s eye view of market dynamics to give buyers and sellers an indication of what to expect in their local real estate market. The average home price included in this analysis applies to the local market as a whole and takes into account a number of different property types, neighbourhoods, and square footage values among other factors. As such, prospective buyers and sellers will benefit from a detailed review of sales, new listings and price trends for specific home types of interest at the city, town, or neighbourhood level.
GTA Cities Dominate List of Ontario Markets With Highest Average Home Price Increases
In 9 of the 28 markets included in our analysis, the average home price grew over $100,000 annually. Oakville topped the list, with the annual average home price increasing a whopping $177,550 or 17% since last year to $1,249,685. Markham followed close behind – the annual average home price grew $171,726 y-o-y, an impressive 19% increase to $1,086,502.
In total, 5 York Region markets posted not just six-figure annual average price growth, but double digit rates of annual average price growth as well. In addition to Markham, the average home price increased by $149,010 or 16% in Aurora to $1,068,255; by $136,466 or 13% in Vaughan to $1,154,352; by $130,514 or 12% in Richmond Hill to $1,213,191, and by $117,193 or 15% in Newmarket to $889,534. Although the average home price increased substantially in these York region markets, sales in June have yet to catch-up to last year’s levels; Richmond Hill had the largest sales gap, with transactions still down 17% from last year.
Mississauga, Halton Hills, and the City of Toronto completed the list of regions where average home prices grew in the six figures annually. Average home prices rose by $140,265 in Mississauga, $111,183 in Halton Hills, and by $106,657 in the City of Toronto.
6 Markets Experienced Annual Sales Growth Over 20%, Including Barrie at 41%
15 of the 28 markets studied experienced y-o-y sales growth this June, with 6 markets even clocking in annual sales increases of over 20%. Barrie led the pack with a staggering 41% increase in sales and 321 homes changing hands last month. New listings in Barrie were slower to catch up in the region and created strong seller’s market conditions this June with a sales-to-new-listings-ratio (SNLR) of 74%.
A seller’s market exists when the SNLR – the ratio of the number of sales to the number of properties listed in a given period – is over 60%. It implies that a greater number of properties sold relative to newly listed homes, favouring sellers over buyers. In Barrie, buyers faced even greater competition this year compared to last June when the SNLR was 56% and housing demand and supply were balanced. Balanced market conditions exist when the SNLR is between 40% and 60%.
Sudbury Region and Pickering rounded up the top three regions with the highest rate of sales growth, with sales increases of 27% and 24% each. Among all the regions included in our analysis, Sudbury exhibited the most prominent seller’s market conditions with an SNLR of 87%. It was even more competitive for Sudbury buyers this year compared to June 2019 when the SNLR was 64%. Pent up buyer demand from April and May, when economic uncertainty was the highest, may have been a contributor to these higher levels of sales in June.
Among the regions with the slowest positive sales growth were Oakville, London, and Milton. Each of these 3 regions experienced a sales increase of 5% y-o-y.
Richmond Hill (-17%), Aurora (-14%), and Mississauga (-14%) experienced the greatest sales declines y-o-y. This was followed by Vaughan (-13%) and the City of Toronto, where 2,830 homes sold in June – a 12% decline y-o-y. Despite a double-digit decline in sales in June, Toronto remained in a balanced market with an SNLR of 46%.
Below find our infographic highlighting average price and sales growth in 28 housing markets across Ontario this June followed by lists of the regions that experienced the highest annual price and sales growth.
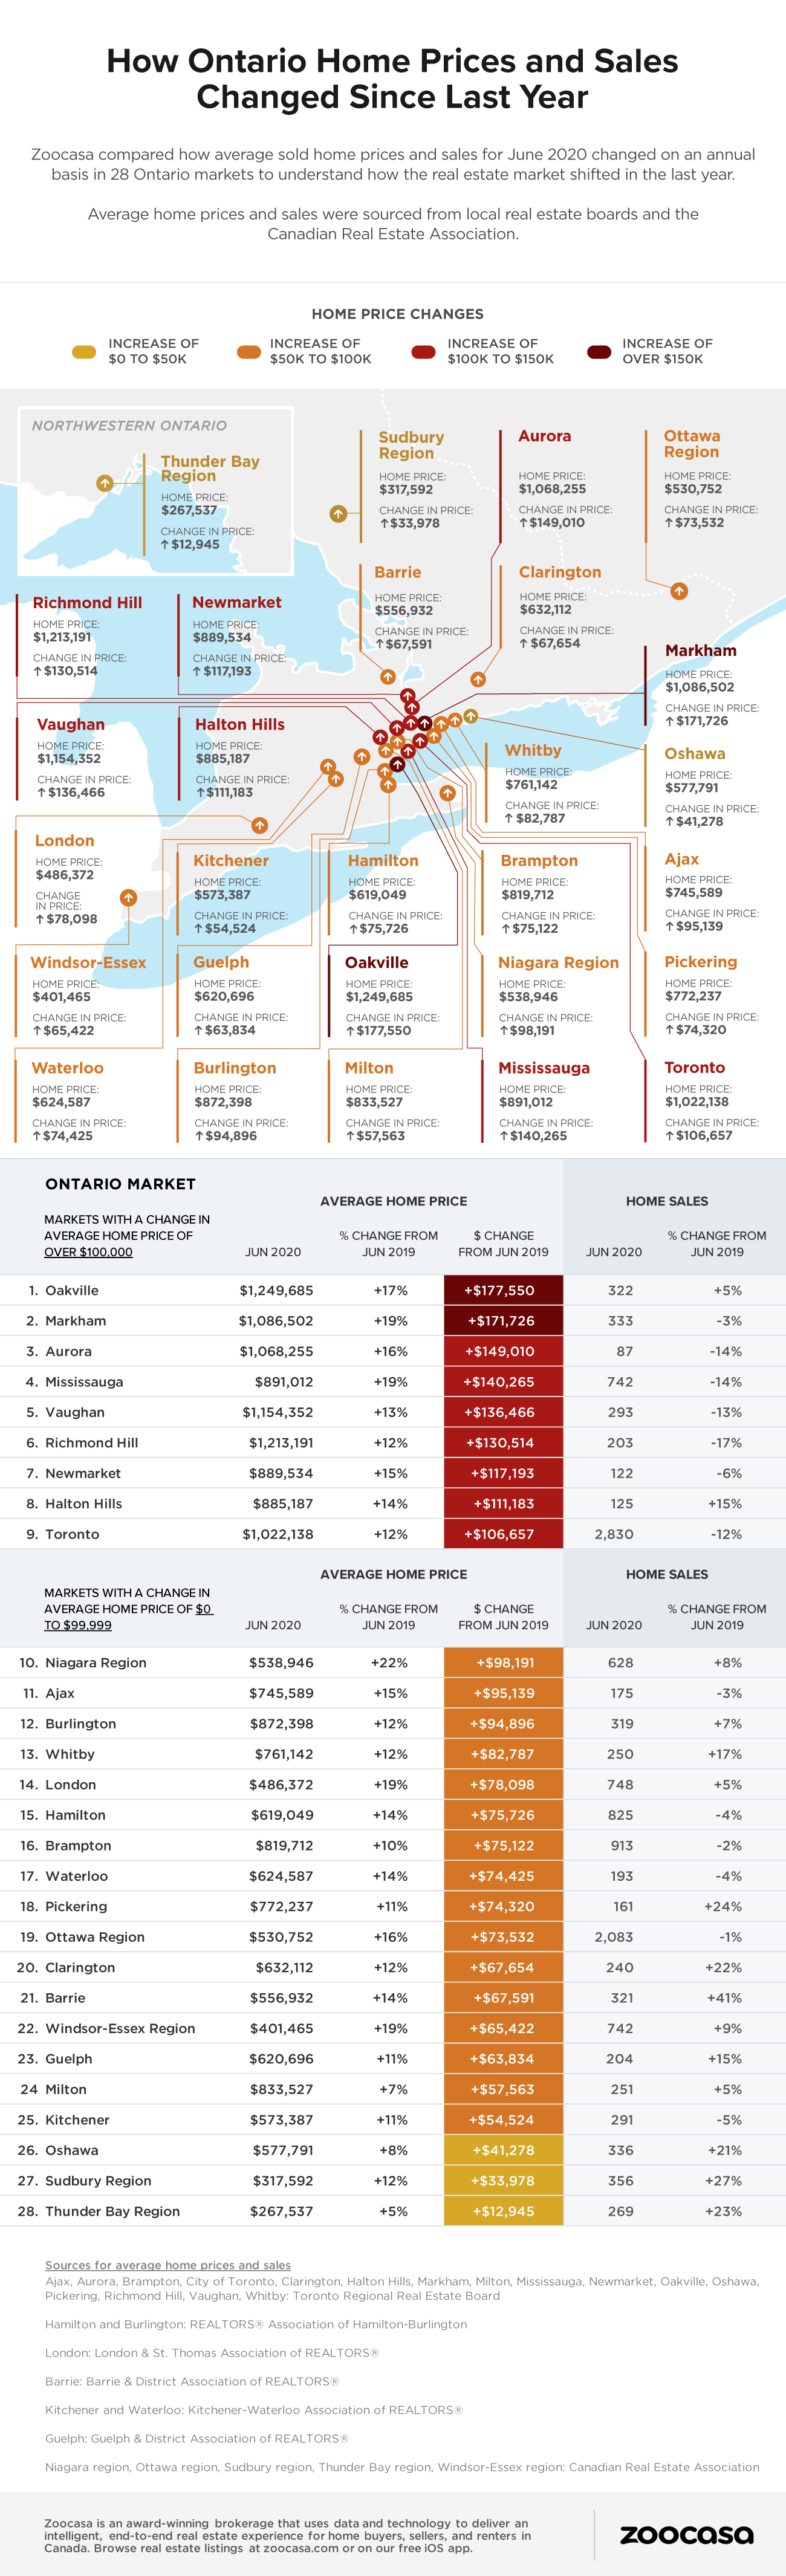
Table of Ontario Home Prices And Sales Growth in June 2020
| Rank | City | Avg. Home Price (Jun 2020) | YoY Price Change (%) | YoY Price Change ($) | Home Sales (Jun 2020) | YoY Sales Change (%) |
|---|---|---|---|---|---|---|
| 1 | Oakville | $1,249,685 | 17% | $177,550 | 322 | 5% |
| 2 | Markham | $1,086,502 | 19% | $171,726 | 333 | -3% |
| 3 | Aurora | $1,068,255 | 16% | $149,010 | 87 | -14% |
| 4 | Mississauga | $891,012 | 19% | $140,265 | 742 | -14% |
| 5 | Vaughan | $1,154,352 | 13% | $136,466 | 293 | -13% |
| 6 | Richmond Hill | $1,213,191 | 12% | $130,514 | 203 | -17% |
| 7 | Newmarket | $889,534 | 15% | $117,193 | 122 | -6% |
| 8 | Halton Hills | $885,187 | 14% | $111,183 | 125 | 15% |
| 9 | Toronto | $1,022,138 | 12% | $106,657 | 2,830 | -12% |
| 10 | Niagara Region | $538,946 | 22% | $98,191 | 628 | 8% |
| 11 | Ajax | $745,589 | 15% | $95,139 | 175 | -3% |
| 12 | Burlington | $872,398 | 12% | $94,896 | 319 | 7% |
| 13 | Whitby | $761,142 | 12% | $82,787 | 250 | 17% |
| 14 | London | $486,372 | 19% | $78,098 | 748 | 5% |
| 15 | Hamilton | $619,049 | 14% | $75,726 | 825 | -4% |
| 16 | Brampton | $819,712 | 10% | $75,122 | 913 | -2% |
| 17 | Waterloo | $624,587 | 14% | $74,425 | 193 | -4% |
| 18 | Pickering | $772,237 | 11% | $74,320 | 161 | 24% |
| 19 | Ottawa Region | $530,752 | 16% | $73,532 | 2,083 | -1% |
| 20 | Clarington | $632,112 | 12% | $67,654 | 240 | 22% |
| 21 | Barrie | $556,932 | 14% | $67,591 | 321 | 41% |
| 22 | Windsor-Essex Region | $401,465 | 19% | $65,422 | 742 | 9% |
| 23 | Guelph | $620,696 | 11% | $63,834 | 204 | 15% |
| 24 | Milton | $833,527 | 7% | $57,563 | 251 | 5% |
| 25 | Kitchener | $573,387 | 11% | $54,524 | 291 | -5% |
| 26 | Oshawa | $577,791 | 8% | $41,278 | 336 | 21% |
| 27 | Sudbury Region | $317,592 | 12% | $33,978 | 356 | 27% |
| 28 | Thunder Bay Region | $267,537 | 5% | $12,945 | 269 | 23% |
Top 5 Markets for Annual Average Price Growth (Dollar)
Oakville
- Average home price, June 2020: $1,249,685 (+$177,550 or +17%)
- Home sales, June 2020: 322 (+5%)
Markham
- Average home price, June 2020: $1,086,502 (+$171,726 or +19%)
- Home sales, June 2020: 333 (-3%)
Aurora
- Average home price, June 2020: $1,068,255 (+$149,010 or +16%)
- Home sales, June 2020: 87 (-14%)
Mississauga
- Average home price, June 2020: $891,012 ( +$140,265 or +19%)
- Home sales, June 2020: 742 (-14%)
Vaughan
- Average home price, June 2020: $1,154,352 (+$136,466 or +13%)
- Home sales, June 2020: 293 (-13%)
Top 5 Markets for Annual Average Price Growth (Percentage)
Niagara Region
- Average home price, June 2020: $538,946 (+$98,191 or +22%)
- Home sales, June 2020: 628 (+8%)
Markham
- Average home price, June 2020: $1,086,502 (+$171,726 or +19%)
- Home sales, June 2020: 333 (-3%)
Mississauga
- Average home price, June 2020: $891,012 (+$140,265 or +19%)
- Home sales, June 2020: 742 (-14%)
London
- Average home price, June 2020: $486,372 (+$78,098 or +19%)
- Home sales, June 2020: 748 (+5%)
Windsor-Essex Region
- Average home price, June 2020: $401,465 (+$65,422 or +19%)
- Home sales, June 2020: 742 (+9%)
Top 5 Markets for Annual Sales Growth (Percentage)
Barrie
- Average home price, June 2020: $556,932 (+$67,591 or +14%)
- Home sales, June 2020: 321 (+41%)
Sudbury Region
- Average home price, June 2020: $317,592 ( +$33,978 or +12%)
- Home sales, June 2020: 356 (+27%)
Pickering
- Average home price, June 2020: $772,237 (+$74,320 or +11%)
- Home sales, June 2020: 161 (+24%)
Thunder Bay Region
- Average home price, June 2020: $267,537 (+$12,945 or +5%)
- Home sales, June 2020: 269 (+23%)
Clarington
- Average home price, June 2020: $632,112 (+$67,654 or +12%)
- Home sales, June 2020: 240 (+22%)
Methodology
Sources for average home prices, sales and new listings:
- Ajax, Aurora, Brampton, City of Toronto, Clarington, Halton Hills, Markham, Milton, Mississauga, Newmarket, Oakville, Oshawa, Pickering, Richmond Hill, Vaughan, Whitby: Toronto Regional Real Estate Board
- Hamilton and Burlington: REALTORS® Association of Hamilton-BurlingtonLondon: London & St. Thomas Association of REALTORS®
- Barrie: Barrie & District Association of REALTORS®
- Kitchener and Waterloo: Kitchener-Waterloo Association of REALTORS®
- Guelph: Guelph & District Association of REALTORS®
- Niagara region, Ottawa region, Sudbury region, Thunder Bay region, Windsor-Essex region: Canadian Real Estate Association
The sales-to-new-listings ratio (SNLR) is calculated as June sales divided by new listings in June.
Contact
For more information about this report or to set up a media interview, please contact [email protected]