
Housing prices in Canada have steadily declined this year since the Bank of Canada began introducing interest rate hikes. The record price highs of last winter are long gone, and many markets in Ontario have experienced fluctuations in average prices, levels of inventory, and transactions.
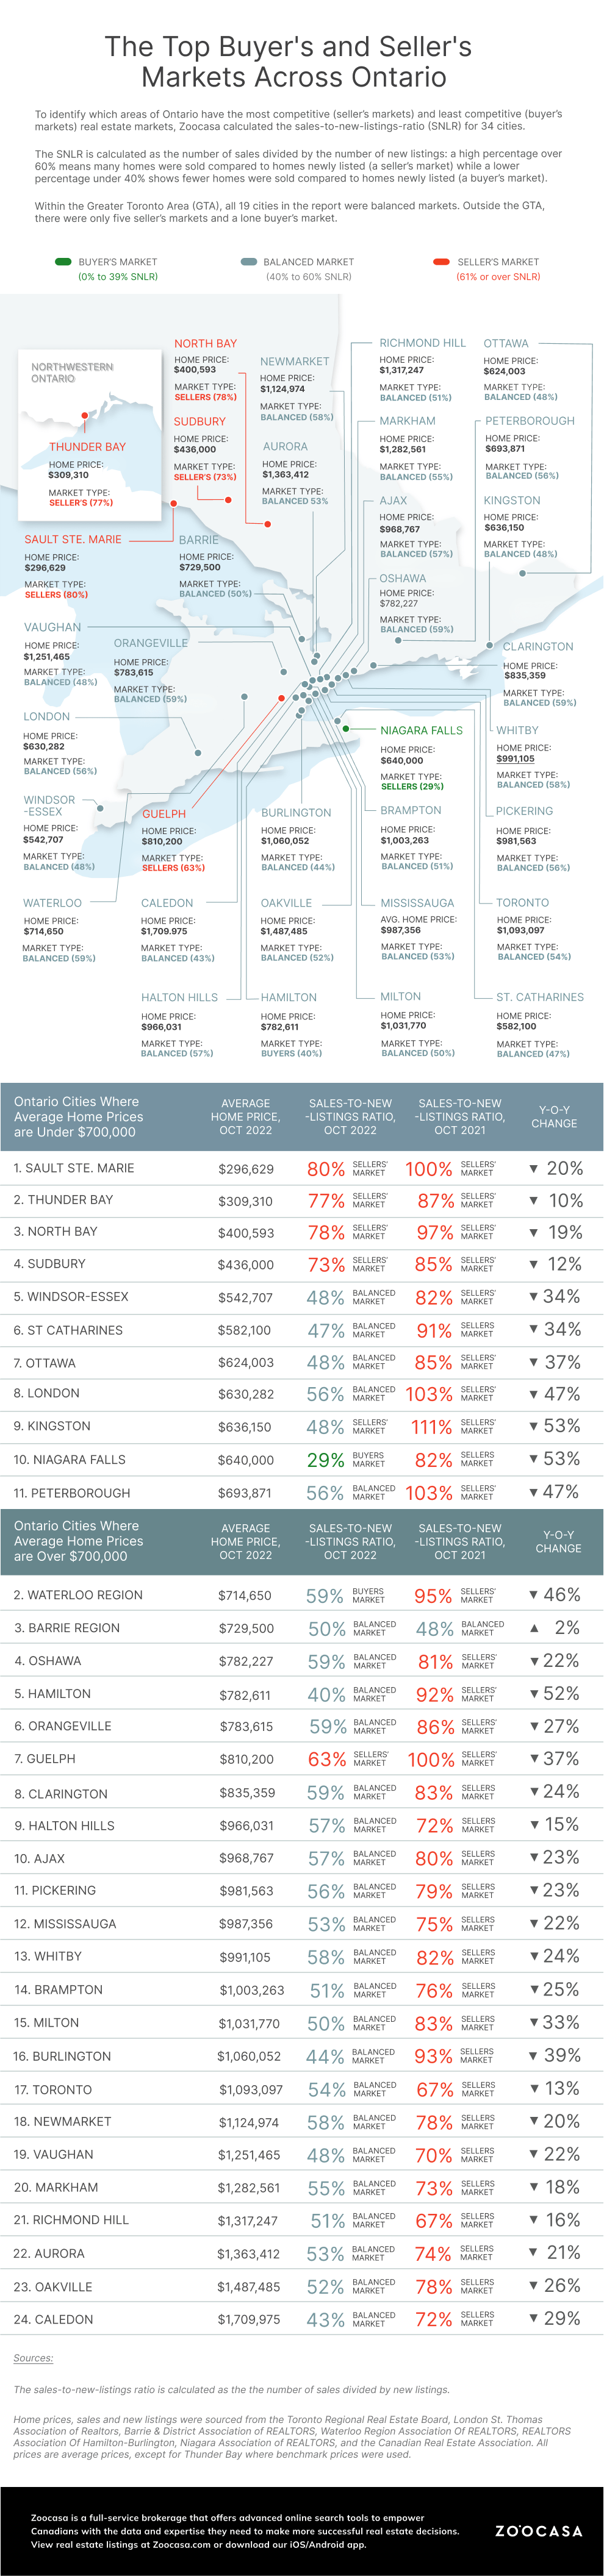
With 2023 just around the corner, we analyzed market competition across 34 cities and regions in Ontario by comparing sales and new listing data for each city for October. This data was then used to determine the sales-to-new-listings ratio (SNLR) for the month, calculated by dividing the total sales by the number of new listings in each region. The SNLR is used to effectively show the level of demand and supply in each area, and help identify how much competition local buyers face with regard to supply. The SNLR can be broken down into three percentage parameters:
- An SNLR under 40% suggests a buyer’s market: where new listings outweigh and buyers have more options
- An SNLR between 40% and 60% is a balanced market: where demand and supply are balanced
- AN SNLR over 60% means a seller’s market: where demand outpaces supply, benefiting sellers
Our findings show that of the 34 markets, just six are currently not in balanced territory, with only one favouring buyers, and the remaining five markets favouring sellers, meaning demand outweighed the supply in the area. The balanced markets are widespread across Ontario, reflecting the stalemate seen between buyers and sellers with interest rate hikes taking priority over financial decisions.
Each GTA Market is Currently in a Balanced State
Housing competition has cooled across the entire GTA, and each market is currently in a balanced state. The area as a whole saw 4,961 sales last month with 10,390 new homes coming to market, leading to an SNLR of 53.2%. With talks of another rate hike in December, it may be a while before the area begins favouring sellers again.
Some cities in the GTA have seen sharper declines than others. Burlington’s SNLR, for example, has fallen by 39% year-over-year to 44%, as sales have dipped by 32% to 163. New listings in Burlington have picked up by 26% to 331. However, markets in the last few months of the year do have a tendency to drop off and this may have some effect on these markets.
There Are Still Some Markets that Favour Sellers
Of the five Ontario markets that do benefit sellers, four of them are in cities where homes are well below the average Canadian home price of $644,643. They are Sault Ste. Marie, Thunder Bay, North Bay, and Sudbury. Of those four, Sudbury has the highest average price of $436,000.
With greater affordability comes more buyers – while interest rates are high, buying somewhere like Thunder Bay, where the average home price is $309,310, is far less costly than trying to buy a home in Markham, where the average price is $1,282,561., Whereas cities like Toronto have seen drops in sales of almost 50% from last year, Thunder Bay has seen a much more modest decline of 4.7%. Sellers still have some luck because the cost of borrowing isn’t as high as it is in larger cities with greater home prices.
Niagara Falls is currently the only buyer’s market. It has experienced a mild improvement in new listings year-over-year, up to 214 from 199. . However, sales have declined from 163 to 62, with properties now spending 37 days on the market, up 106% from last year. With 214 new listings coming to market, buyers have more inventory to choose from. The SNLR here declined by 53% to 29%, the steepest drop across every area we covered alongside Kingston.
Methodology
The sales-to-new-listings ratio is calculated as the number of sales divided by new listings.
Home prices, sales and new listings were sourced from the Toronto Regional Real Estate Board, London St. Thomas Association of Realtors, Barrie & District Association of REALTORS, Waterloo Region Association Of REALTORS, REALTORS Association Of Hamilton-Burlington, Niagara Association of REALTORS, and the Canadian Real Estate Association. All prices are average prices, except for Thunder Bay where benchmark prices were used.