The Metro Vancouver housing market has gone through some dramatic changes over the last six months, as buyer demand has been hit by tougher federal mortgage qualification rules as well as province-specific taxes targeting foreign and speculative real estate investment.
As a result, the British Columbia and Vancouver real estate markets are going through a correction; sales have fallen by double-digit percentages, while supply continues to pile up. According to the latest data from the Real Estate Board of Greater Vancouver, sales were down 29.1% in April from the year before, and 43.1% below the 10-year average, while the total number of available Vancouver homes for sale skyrocketed by 46.2%.
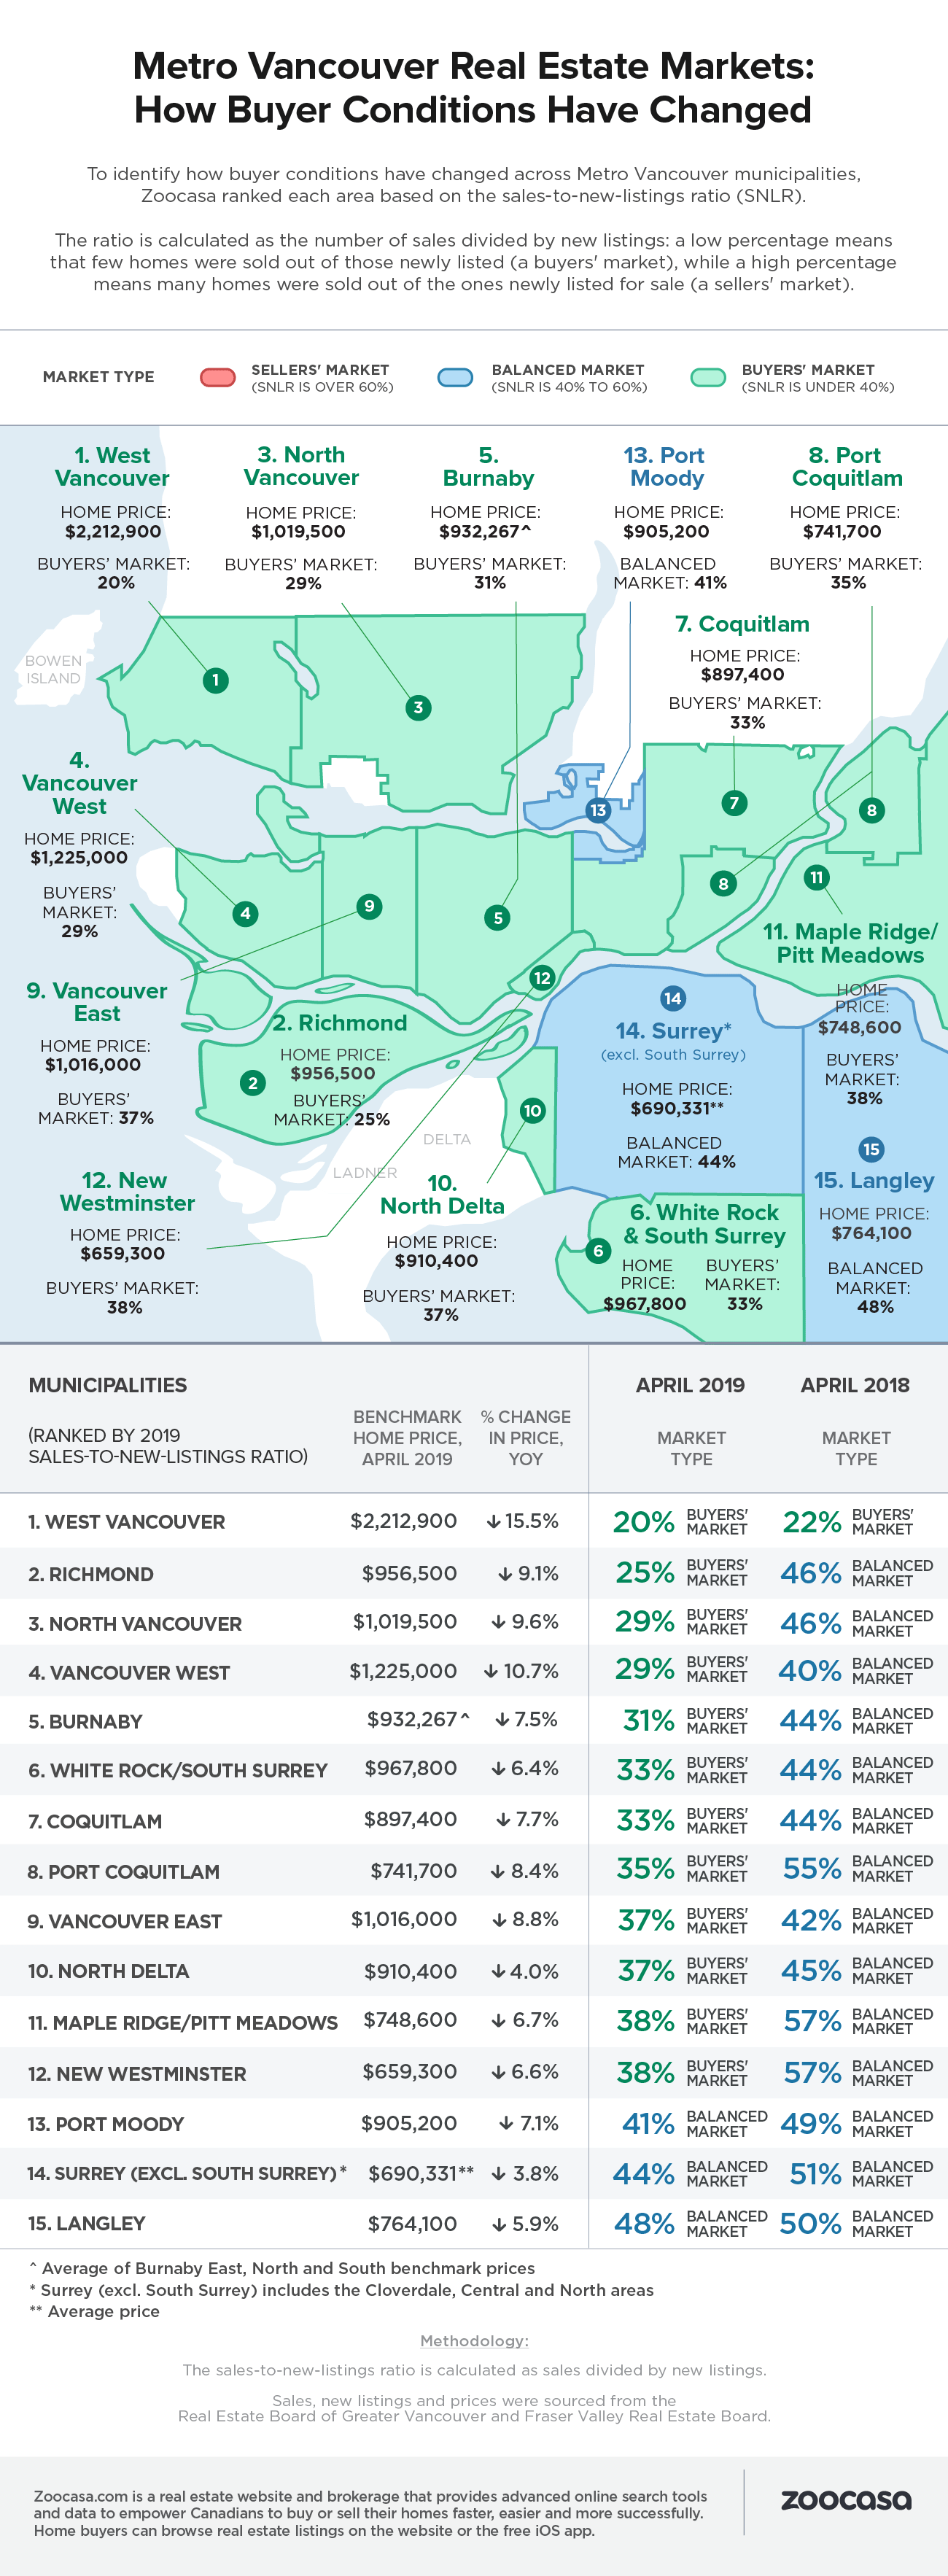
The combination of slowing sales and a flux of inventory has cooled buyer conditions in municipalities across Metro Vancouver, pushing many into buyers’ markets from the balanced territory they were in last year. As a result, buyers may have more choice at a lower price point, though sellers are likely to see their listings remain on the market for longer without the competitive factors at play, such as bidding wars, that typically heat prices.
To determine the extent of the market correction throughout the Metro Vancouver region, Zoocasa ranked 15 areas according to their sales-to-new-listings (SNLR) ratios in April, compared to the same month in 2018. This metric is calculated by dividing the number of sales divided by new listings over the course of the month. The Canadian Real Estate Association defines a balanced market as having an SNLR between 40 – 60%, with ratios above and below that threshold indicating sellers’ and buyers’ market conditions, respectively.
Data was sourced from the Real Estate Board of Greater Vancouver as well as the Fraser Valley Real Estate Board. Sales and new listings figures mentioned below includes detached, attached, and apartment home types.
West Vancouver is Region’s Weakest Market
The upscale neighbourhood of West Vancouver tops the list as the weakest buyers’ market, with an SNLR of 20%, reflective of a -14% year-over-year drop in sales – a total of 48 transactions. While the supply of new listings also fell by -6% with 243 homes brought to market, slowing conditions were enough to drive prices down by -15%, to a benchmark of $2,212,900. Slowing conditions, however, aren’t a new development for this neighbourhood, which has been in correction mode over the last year following an increase in foreign buyer taxation, and the implementation of the federal mortgage stress test; last year’s SNLR also indicated a buyers’ market at 22%.
That’s followed by Richmond which, with a ratio of 25%, has seen a considerable contraction over the last year, plunging the neighbourhood into a buyers’ market from its previously balanced ratio of 46%. Sales have fallen -45% year over year to 172 transactions, compounding on a 1% increase in new listings (a total of 690). That’s pushed the benchmark price lower by -9.1% to $956,500. North Vancouver rounds out the top three buyers’ markets with a ratio of 29%, down from 46% the year before. That’s reflective of a -33% drop in sales, and a 6% uptick in new listings, pushing prices down by -9.6 to $1,019,500. Vancouver West also came in with a ratio of 29%, though its overall sales decline was less pronounced at -27% and the neighbourhood’s supply of new listings stayed flat. The benchmark price fell -10.7% to $1,225,000.
Some Markets Remain Balanced
While there are currently no sellers’ markets in Metro Vancouver, three can still be considered balanced. Langley has the tightest market in the region with an SNLR of 48%, only slightly lower than 50% in 2018. Sales have been comparatively stable, dipping just -2% to a total of 246 transactions, while new listings have increased by 2%. Benchmark prices have decreased by -5.9% to $764,100.
Surrey (excluding South Surrey) follows with a ratio of 44% – while down considerably from the 51% recorded last year, that remains relatively balanced; despite a -20% drop in sales, an -8% decline in new listings helped offset slower activity. Prices are down -3.8% to an average of $690,331.
Rounding out the most balanced markets is Port Moody with a ratio of 41%, down from 49% last year. Sales have actually increased in the city by 6% at 57 transactions, though that was outstripped by a 25% increase in new listings, prompting benchmark prices to dip by -7.1% to $905,200.
Check out how buying conditions have changed in the Metro Vancouver housing market in the infographic below.
Please note: The contents of this post were updated from an earlier version that contained a data error. Additionally, in the previous version, areas included in the study were ranked by months of inventory.