
This year has already proven to be a new record-setter for national home sales, according to the latest report from the Canadian Real Estate Association – a total of 581,275 homes have traded hands thus far in 2021, already outpacing the 552,423 sales that occurred over the entirety of 2020.
October Buyer Demand Back to Early Spring Levels
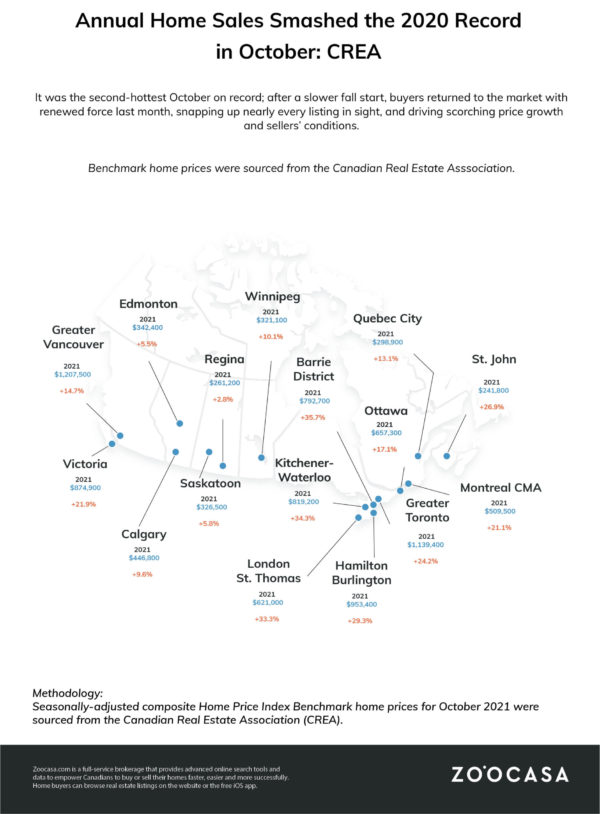
It was also the second-hottest October on record; after a slower fall start, buyers returned to the market with renewed force last month, snapping up nearly every listing in sight, and driving scorching price growth and sellers’ conditions.
CREA reports a total of 53,746 transactions (seasonally adjusted) last month, marking an increase of 8.6% from September, the largest monthly uptick so far this year. While year-over-year numbers are still lagging the record set in 2020 by 11.5%, that gap is steadily shrinking each month.
Related Read: October the Second-Hottest on Record for GTA Home Sales
Sales were up in three-quarters of all local markets, says CREA, devouring a slight 3.2% increase in new listings, which still linger nearly 20% below last year’s levels. Inventory remains extremely low at 1.9 months – almost half what was available three months ago, and on par with the conditions seen in February and March. To put that into perspective, the long-term average is more than five months for this time of year.
“2021 continues to surprise. Sales beat last year’s annual record by about Thanksgiving weekend so that was always a lock, but I don’t think too many observers would have guessed the monthly trend would be moving up again heading into 2022,” said Shaun Cathcart, CREA’s Senior Economist. “A month with more new listings is what allows for more sales because those listings are mostly all still getting gobbled up; however, with demand that strong, the supply of homes for sale at any given point in time continues to shrink. It is at its lowest point on record right now, which is why it’s not surprising prices are also re-accelerating. We need to build more housing.”
Thinking of selling your home? Connect with a Zoocasa agent:
Sellers’ Markets Reign Supreme Across Canada
CREA notes that the majority of Canada’s cities and towns can be considered sellers’ markets, with a national sales-to-new-listings ratio (SNLR) of 79.5%. This ratio, which is calculated by dividing the numbers of sales by the number of new listings during the month, reflects the level of competition in the market; a range between 40 – 60% indicates a balanced market, with above and below that threshold indicating sellers’ and buyers’ conditions, respectively.
Such limited supply, combined with fierce demand, continues to put the boil under home price growth, with the national average up 18.2% annually to $716,585, and the MLS Home Price Index up 23.4%.
By province, prices have seen the strongest growth in Ontario, where they’re pushing 30% year over year, with much of that focused in the Greater Toronto Area. Values are up 20% in British Columbia, though it’s notably the communities outside of Vancouver that are seeing the largest increases. Prices in the prairies are up in the low- to mid-single digits, while the eastern provinces are sizzling, up 30% in New Brunswick, and 10% in Newfoundland and Labrador.
Check out the infographic below to see how benchmark home prices performed in major markets across Canada in October:
October Brings a Strong Fall Market to Major Ontario Cities
With sales increasing in three-quarters of major markets in October, with listings unable to match their pace, many key markets were pushed into stronger seller’s markets. Here’s how October’s numbers impacted five key Ontario markets.
Compared to Last Year, The Toronto Region has Become a Stronger Seller’s Market
Compared to this time last year, where the Greater Toronto Region’s non-seasonally adjusted SNLR barely made it into seller’s market territory at 60.3%, October 2021 showed a stark increase in market competition as the ratio hit 72.9%.
This increase in SNLR was influenced by the high number of sales in the region last month, with 9,716 total transactions up 9.9% from last month, while the number of new listings did not keep up with this month-over-month growth. Prices grew 24.2% from this time last year, up to a benchmark of $1,139,400.
Check out the latest homes for sale in Toronto:
Ottawa Prices Grow Steadily
Prices in the Ottawa Region hit $657,300 last month, growing 17.1% from last year. Although still in a strong seller’s market, with an SNLR of 80%, buyers in this market faced less competition than other major Ontario cities, many of which saw the ratio hit nearly 90% this month.
A total of 1,667 residential transactions occurred last month, an increase of 8.7% from September. During this same period, 2,166 new listings came to the market, up 3.9% from last month.
Check out the latest homes for sale in Ottawa:
Red-Hot Increase in Sales in Kitchener-Waterloo has Prices Scorching
The fall market hit Kitchener-Waterloo with a bang in October, with total sales numbers reaching 624 in October, an increase of 29.5% from last month. With only 708 new listings coming to the market during that time, the SNLR jumped to 88.1%, pushing a market already firmly in seller’s market territory into overdrive.
These tight market conditions contributed to prices reaching new heights in the Region, up 34.3% this year to a total of $819,200.
Check out the latest homes for sale in Kitchener:
Prices Soar in Hamilton-Burlington
Prices in Hamilton Burlington crept closer to the 1-million mark in October, reaching an average of $953,400 last month, up 29.3% from this time last year. The strong seller’s market in the region is providing no relief to buyers looking to make a purchase in today’s market.
The SNLR hit a strong 88% last month, an increase that was driven by growth in sales volumes outpacing the growth of new listings coming to the market. A total of 1,258 transactions took place (+8% from last month) with 1,429 new listings coming to the market (+5% from last month.)
Check out the latest homes for sale in Hamilton:
New Inventory Remains Flat in London and St. Thomas, while Rising Sales Drive Up Competition
Benchmark prices in London grew 33.3% from last year, and reached a high of $621,000 last month. During this time, the total number of sales grew 7.1% from last month to 947 in a strong fall market – but the number of new listings available to buyers stayed relatively flat at 1,083 (up 0.7% from last month).
Sales increasing while new listings aren’t keeping up their pace is a recipe for tight competition in the market – which led to the SNLR jumping to 87.4% last month, indicating a strong seller’s market.
Check out the latest homes for sale in London:
Thinking of selling your home? Check out Zoocasa’s Seller’s Guide!