
American and Canadian home buyers may have their unique cultural nuances, but whether they live north or south of the border, they face similar issues when buying housing: incomes keeping pace with real estate prices in the hottest markets.
While real estate in our respective countries has been impacted by dramatically
The ability for a median-income earner to purchase the median-priced home also swings wildly from market to market in both countries, with the steepest affordability in the largest business centres; in fact, a recent study by
A Cross-Border Comparison
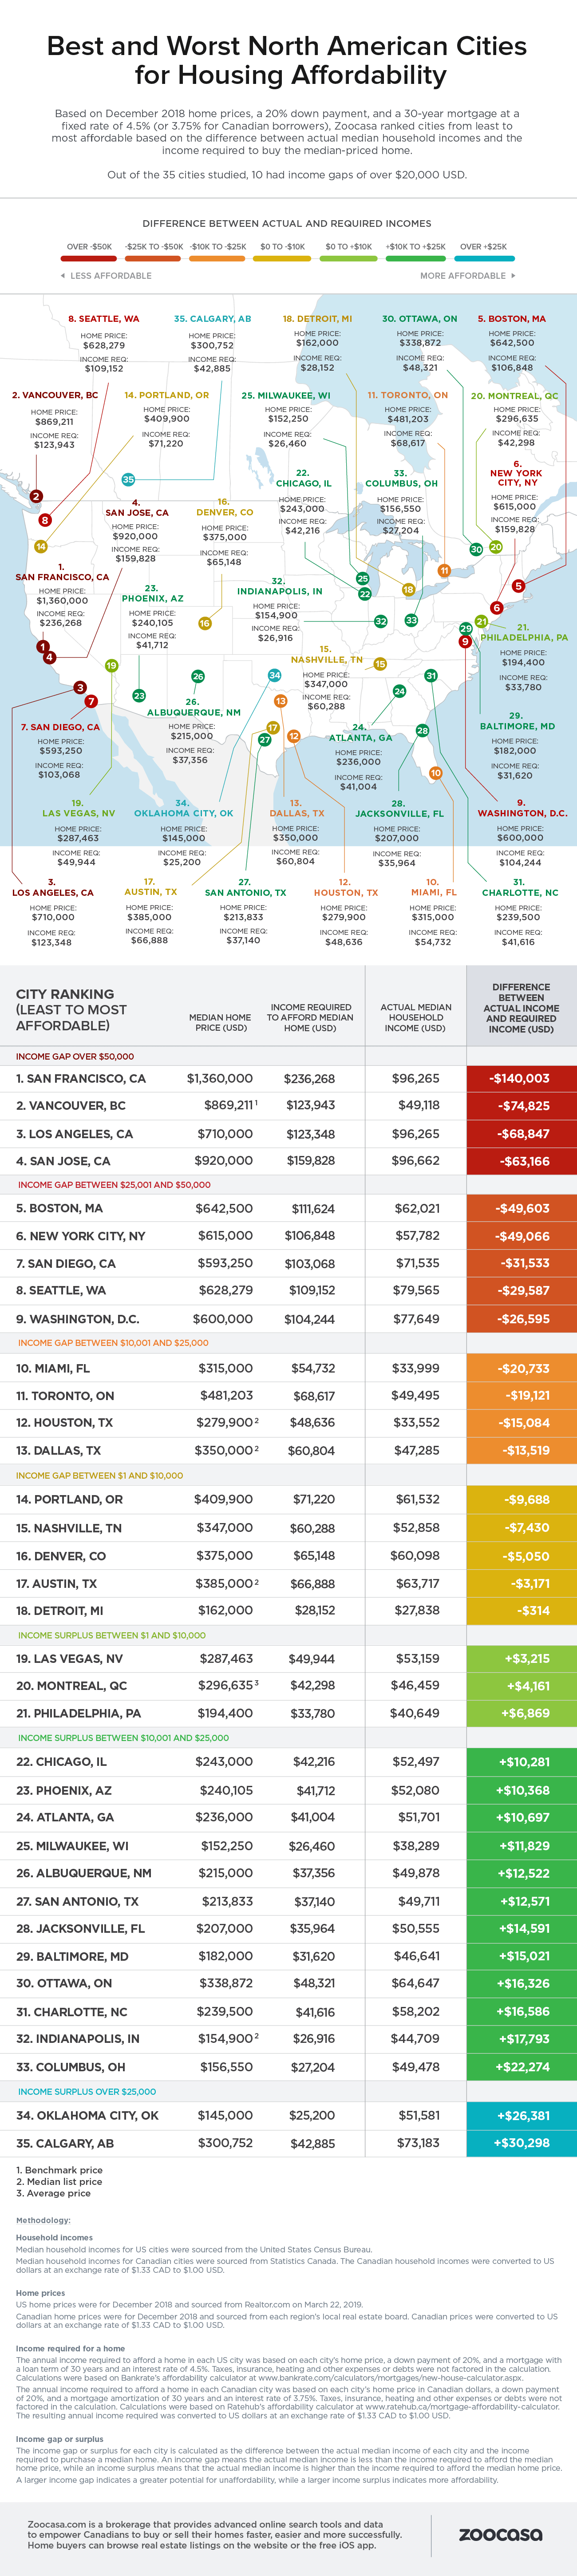
To determine the level of affordability in each market, the study sourced December 2018 median home prices for 30 major U.S. markets and five Canadian, and calculated the minimum income required to purchase in each city. That amount was then compared to the actual median income earned, to determine whether the market presented buyers with an income surplus (when the median income is sufficient, or more than enough to purchase the median-priced home), or an income gap, which indicates incomes have not kept pace with real estate price growth.
For the calculation, it was assumed a 20% down payment is made, and the mortgage is taken out over a 30-year timeline (per term for U.S. borrowers, and amortization for Canadian). U.S. affordability was calculated with a fixed mortgage rate of 4.5%, while 3.75% was used for Canadian borrowers, to reflect the average mortgage rate available to an applicant with good credit. Additional debt, taxes, insurance, heating, and other homeownership-related expenses were not included. Canadian dollar figures were then converted to U.S. dollars at an exchange rate of $1.33 CAD to $1.00 USD.
The Least Affordable North American Markets
According to the findings, the least affordable market was San Francisco, where a household earning the median of $96,265 finds themselves $140,003 short on the median-priced home valued at $1,360,000.
Vancouver real estate, Canada’s most expensive housing market, places second overall in terms of unaffordability with an income gap of $74,825 ($99,517 CAD), compared to a median income of $49,118 ($65,327 CAD).
Vancouver is followed on the list by Los Angeles, where the median income of $54,501 is $68,847 short of affording the median home price of $710,000. The most unaffordable U.S. markets are rounded out by San Jose, where buyers face an income gap of $63,166, based on a home price of $920,000 and earnings of $96,662.
Midwest, Northeast Home to Most Affordable U.S. Markets
The title of most affordable American market goes to Oklahoma City, where home prices have remained lower than the national median, and incomes have more than kept pace; those earning the median of $51,581 make double of $25,200 required to purchase a home at $145,000, meaning buyers enjoy a surplus of $26,381.
That’s followed by Colombus, where an income of $49,478 is more than adequate to purchase a $156,550 with $22,274 left over. Rounding out the top three most affordable markets is Indianapolis, where the median home goes for $154,900 – easily affordable on the median income of $44,709, resulting in a surplus of $17,793.
Affordability of Canadian Cities vs. US Cities
Toronto real estate, the largest city in Canada, ranks 11th overall, with unaffordability on par with Miami: A Torontonian earning the median income of $49,495 ($65,829 CAD) faces a gap of $19,121 ($25,431 CAD), while households in the Florida city earning the median income of $33,999 fall $20,733 below what they’d need to earn to qualify for a mortgage on the median-priced home. Out of all 35 North American markets included in the study, 18 are considered to face such an income gap.
However, three of the Canadian cities studied do fall within the realm of affordability, as do 14 American markets: Montreal, which ranks 20th on the list and is in line with Las Vegas and Philadelphia, enjoys an income surplus of $4,161, based on median household income of $46,459. Las Vegas and Philadelphia have income surpluses of $3,215 and $6,869, respectively.
Ottawa, the capital of Canada, was the 6th most affordable city in the study, with an income surplus of $16,326 ($27,714 CAD), based on the median income of $64,647 ($85,981 CAD). Buyers in Washington, D.C., on the other hand, face a gap of $26,595 between the median household income of $77,649 and the $104,244 income required to buy a median home priced at $600,000.
Calgary real estate can be considered the most affordable of all the studied markets, with a whopping surplus of $30,298 ($40,297 CAD), and a median household income of $73,183 ($97,334 CAD).
Check out the infographic below to see how each U.S. and Canadian market ranks according to housing affordability (dollar amounts are in US dollars):
The 5 Least Affordable Housing Markets in Canada and the U.S.
1 – San Francisco, CA
Median home price: $1,360,000
Required income: $236,268
Actual median income: $96,265
Income gap: $140,003
2 – Vancouver, BC
Benchmark home price: $869,211 ($1,156,050 CAD)
Required income: $123,943 ($164,844 CAD)
Actual median income: $49,118 ($65,327 CAD)
Income gap: $74,825 ($99,517 CAD)
3 – Los Angeles, CA
Median home price: $710,000
Required income: $123,348
Actual median income: $54,501
Income gap: $68,847
4 – San Jose, CA
Median home price: $920,000
Required income: $159,828
Actual median income: $96,662
Income gap: $63,166
5 – Boston, MA
Median home price: $642,500
Required income: $111,624
Actual median income: $62,021
Income gap: $49,603
The 5 Most Affordable Housing Markets in Canada and the U.S.
1 – Calgary, AB
Median home price: $300,752 ($400,000 CAD)
Required income: $42,885 ($57,037 CAD)
Actual median income: $73,183 ($97,334 CAD)
Income surplus: $30,298 ($40,297 CAD)
2 – Oklahoma City, OK
Median home price: $145,000
Required income: $25,200
Actual median income: $51,581
Income surplus: $26,381
3 – Columbus, OH
Median home price: $156,550
Required income: $27,204
Actual median income: $49,478
Income surplus: $22,274
4 – Indianapolis, IN
Median home price: $154,900
Required income: $26,916
Actual median income: $44,709
Income surplus: $17,793
5 – Charlotte, NC
Median home price: $239,500
Required income: $41,616
Actual median income: $58,202
Income surplus: $16,586
Methodology
Income gap or surplus
The income gap or surplus for each city is calculated as the difference between the actual median income of each city and the income required to purchase a median home.
An income gap means the actual median income is less than the income required to afford the median home price, while an income surplus means that the actual median income is higher than the income required to afford the median home price.
A larger income gap indicates a greater potential for unaffordability, while a larger income surplus indicates more affordability.
Household incomes
Median household incomes for US cities were sourced from the United States Census Bureau.
Median household incomes for Canadian cities were sourced from Statistics Canada. The Canadian household incomes were converted to US dollars at an exchange rate of $1.33 CAD to $1.00 USD.
Income required for a home
The annual income required to afford a home in each US city was based on each city’s home price, a down payment of 20%, and a mortgage with a loan term of 30 years and an interest rate of 4.5%. Taxes, insurance, heating and other expenses or debts were not factored in the calculation. Calculations were based on Bankrate’s affordability calculator at www.bankrate.com/calculators/mortgages/new-house-calculator.aspx.
The annual income required to afford a home in each Canadian city was based on each city’s home price in Canadian dollars, a down payment of 20%, and a mortgage amortization of 30 years and an interest rate of 3.75%. Taxes, insurance, heating and other expenses or debts were not factored in the calculation. Calculations were based on Ratehub’s affordability calculator at www.ratehub.ca/mortgage-affordability-calculator. The resulting annual income required was converted to US dollars at an exchange rate of $1.33 CAD to $1.00 USD.
Home prices
US home prices were for December 2018 and sourced from Realtor.com on March 22, 2019.
Canadian home prices were for December 2018 and sourced from each region’s local real estate board. Canadian prices were converted to US dollars at an exchange rate of $1.33 CAD to $1.00 USD.