
Housing market activity remained at historically high levels across Canada, based on new data from the Canadian Real Estate Association (CREA). Home sales grew 32% year-over-year, and home prices rose 14% annually to $603,344. On the whole, the 15% growth in new listings couldn’t quite keep up with blockbuster demand, and some regional markets like Calgary (-8%) and Edmonton (-2%) even experienced annual new listing declines.
According to CREA Senior Economist, Sean Cathcart, 2020 is on track to be a historic year for Canadian home sales, despite “historically low supply.” Looking to 2021, Cathcart notes that “…vaccination is a light at the end of the tunnel. Immigration and population growth will ramp back up, mortgage rates are expected to continue to remain very low, and a place to call home is more important than ever. On top of that, the COVID-related shake-up to so much of daily life will likely continue to result in more people choosing to pull up stakes and move around.”
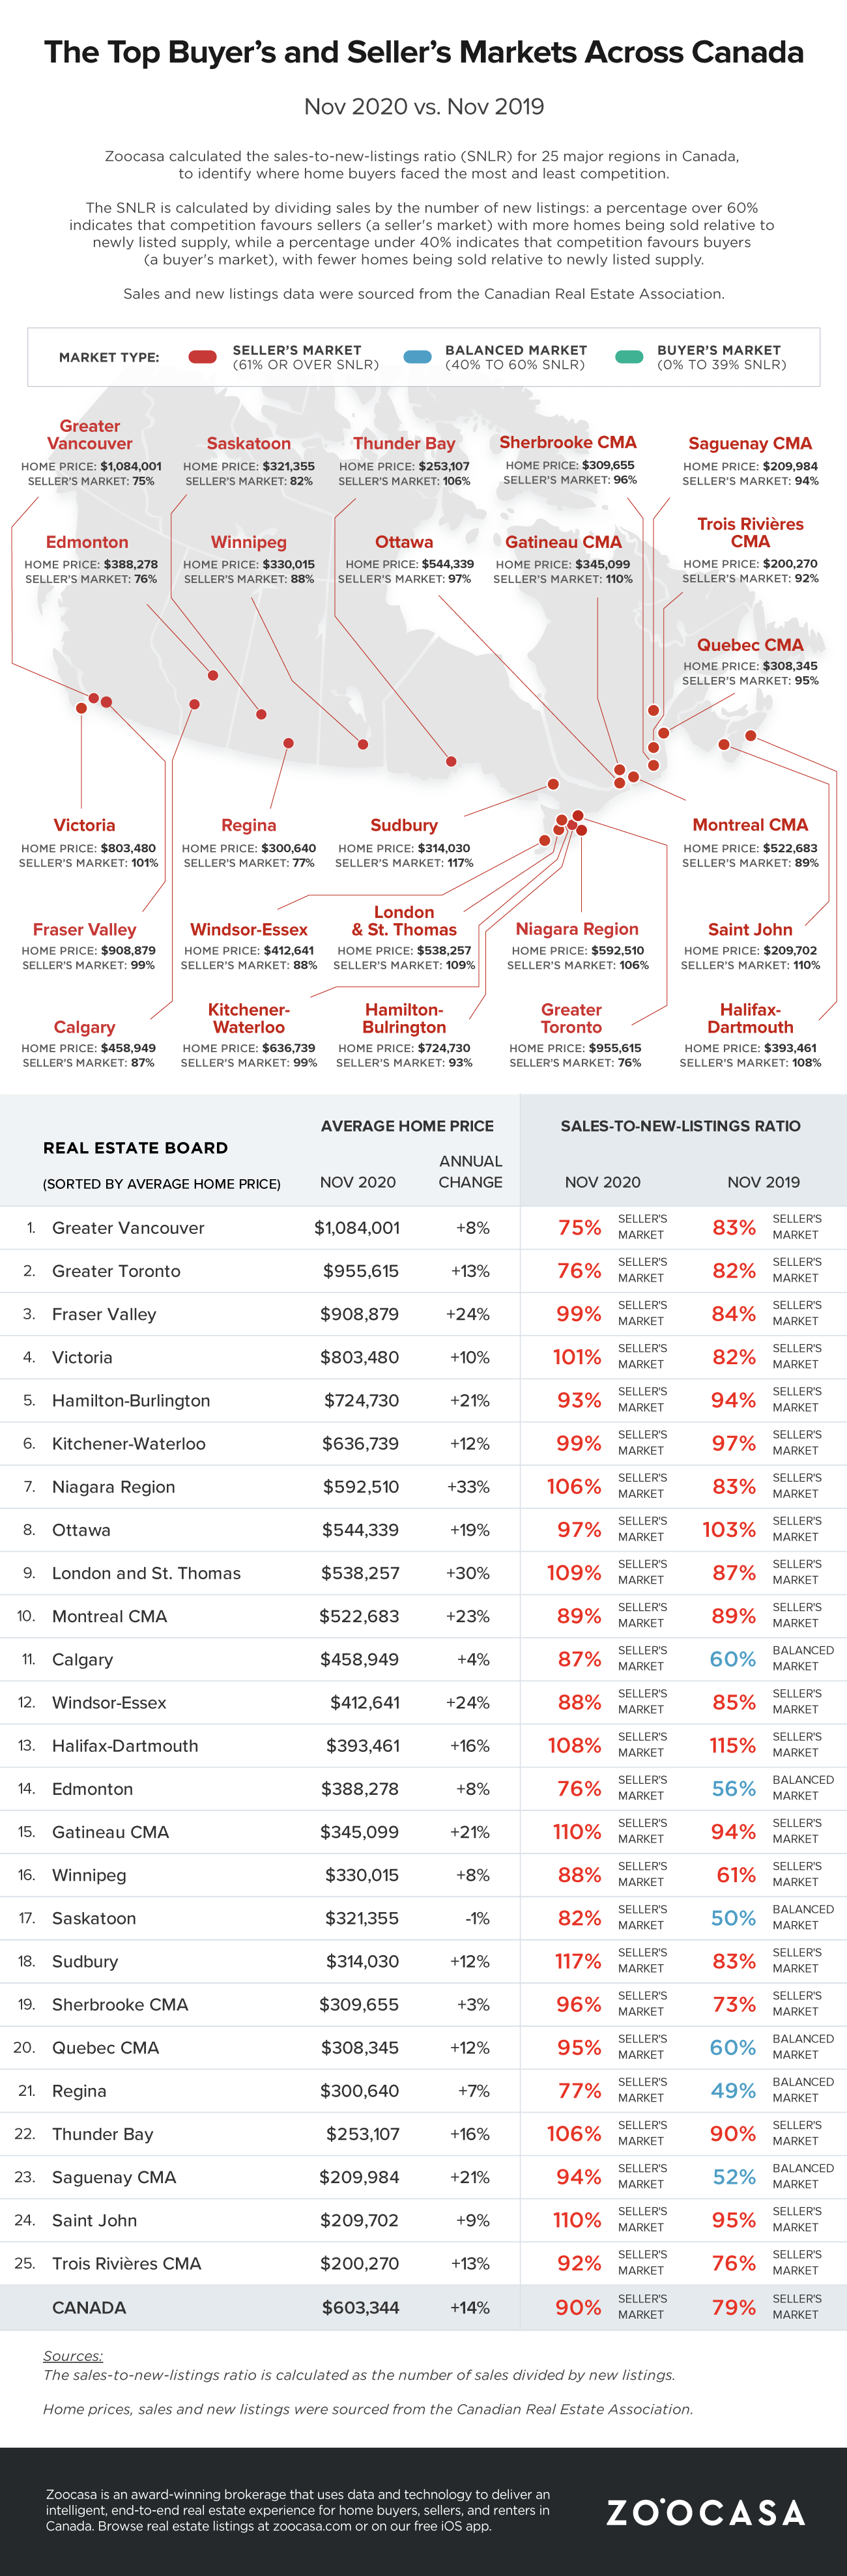
To understand how buyers and sellers in Canada’s major housing markets fared this fall, Zoocasa took a closer look at housing competition across 25 Canadian housing markets by reviewing sales and new listings data for each region for the month of November. With this data, Zoocasa determined the sales-to-new-listings ratio (SNLR) to illustrate demand and supply dynamics in each market, and to identify the degree of competition local buyers faced in relation to supply. SNLR is calculated by dividing sales by new listings for a specified time period, and:
- An SNLR under 40% depicts a buyer’s market: where new listings outstrip sales, and buyers have greater choice
- An SNLR between 40% and 60% depicts a balanced market: where demand and supply are in balance
- An SNLR over 60% depicts a seller’s market: where sellers may have the upper hand as demand outpaces supply
Our findings show that given historically low supply in relation to demand, the Canadian housing market as a whole overwhelmingly favoured sellers, with an SNLR of 90%. All 25 markets included in our analysis exhibited competition conditions that strongly favoured sellers over buyers. Comparatively, in 2019, 19 of these 25 markets were seller’s markets, with the remainder exhibiting balanced market conditions, and the national SNLR was 79%
8 Canadian Housing Markets Exhibited an SNLR over 100% in November
Of the 25 regions included in our analysis, fiery hot demand coupled with limited inventory resulted in very competitive housing conditions for home buyers in 8 regions, where the SNLR was over 100%. That meant that demand was much higher than new listings and buyers began to purchase properties that were listed prior to November.
Canada’s most competitive housing market for buyers was Sudbury, with an SNLR of 117%, where November sales grew 26% year-over-year while listings dropped by 10%.
Saint John and Gatineau followed next, each with an SNLR of 110%. Home sales grew 30% in Saint John, while new listings increased 12%. That being said, the average home price in both regions remained under $350,000 – with Saint John at $209,702 (up 9% from 2019) and Gatineau at $345,099 (up 21% from 2019) – making them one of the most affordable housing markets in Canada based on average price.
The full list of Canadian regions with an SNLR over 100% were: Sudbury (SNLR of 117%), Saint John (SNLR of 110%), Gatineau (SNLR of 110%), London and St. Thomas (SNLR of 109%), Halifax-Dartmouth (SNLR of 108%) Thunder Bay (SNLR of 106%), Niagara Region (SNLR of 106%), and Victoria (SNLR of 101%).
Greater Toronto Among Only 3 Markets That Were Less Competitive for Buyers Compared to 2019
Some of Canada’s largest housing markets, including Greater Toronto, were among those that were less competitive for buyers in November 2020, compared to last year. Although Greater Toronto, Greater Vancouver, and Hamilton-Burlington exhibited strong seller’s market conditions, the SNLR declined on a y-o-y basis.
In Greater Toronto, the SNLR was 76% (down from 82% in 2019), with sales growing 24% and new listings rising 34%. The average sold home price in the region was $955,615.
Similarly, in Greater Vancouver, the SNLR dropped from 83% in 2019 to 75% this November, and in Hamilton-Burlington it declined slightly from 94% to 93%. Home prices rose in both regions on an annual basis – rising 8% in Greater Vancouver to $1,084,001 and 21% in Hamilton-Burlington to $724,730.
Check out the infographic below to see which Canadian housing markets were most and least competitive in November, and how they compared to the same time period in 2019.
Sources and Contact
The sales-to-new-listings ratio is calculated as the number of sales divided by new listings.
Home prices, sales and new listings were sourced from the Canadian Real Estate Association.
For more information about this report or to set up a media interview, please contact [email protected]