
National home sales and listings continued to climb in housing markets across the country this August, as some of the pressure from pent-up demand was released this summer when pandemic restrictions eased. Buyers returning to the market did so with refocused housing priorities; a growing number began looking to suburban and rural markets in search of greater square footage relative to what’s available in denser urban centres.
Despite the surge in demand, the Canada Housing and Mortgage Corporation (CMHC) recently reiterated their forecast that home prices are likely to dip in the coming months; citing pandemic-induced unemployment and slower in-bound migration weighing on demand, particularly in metropolitan cities like Toronto and Vancouver.
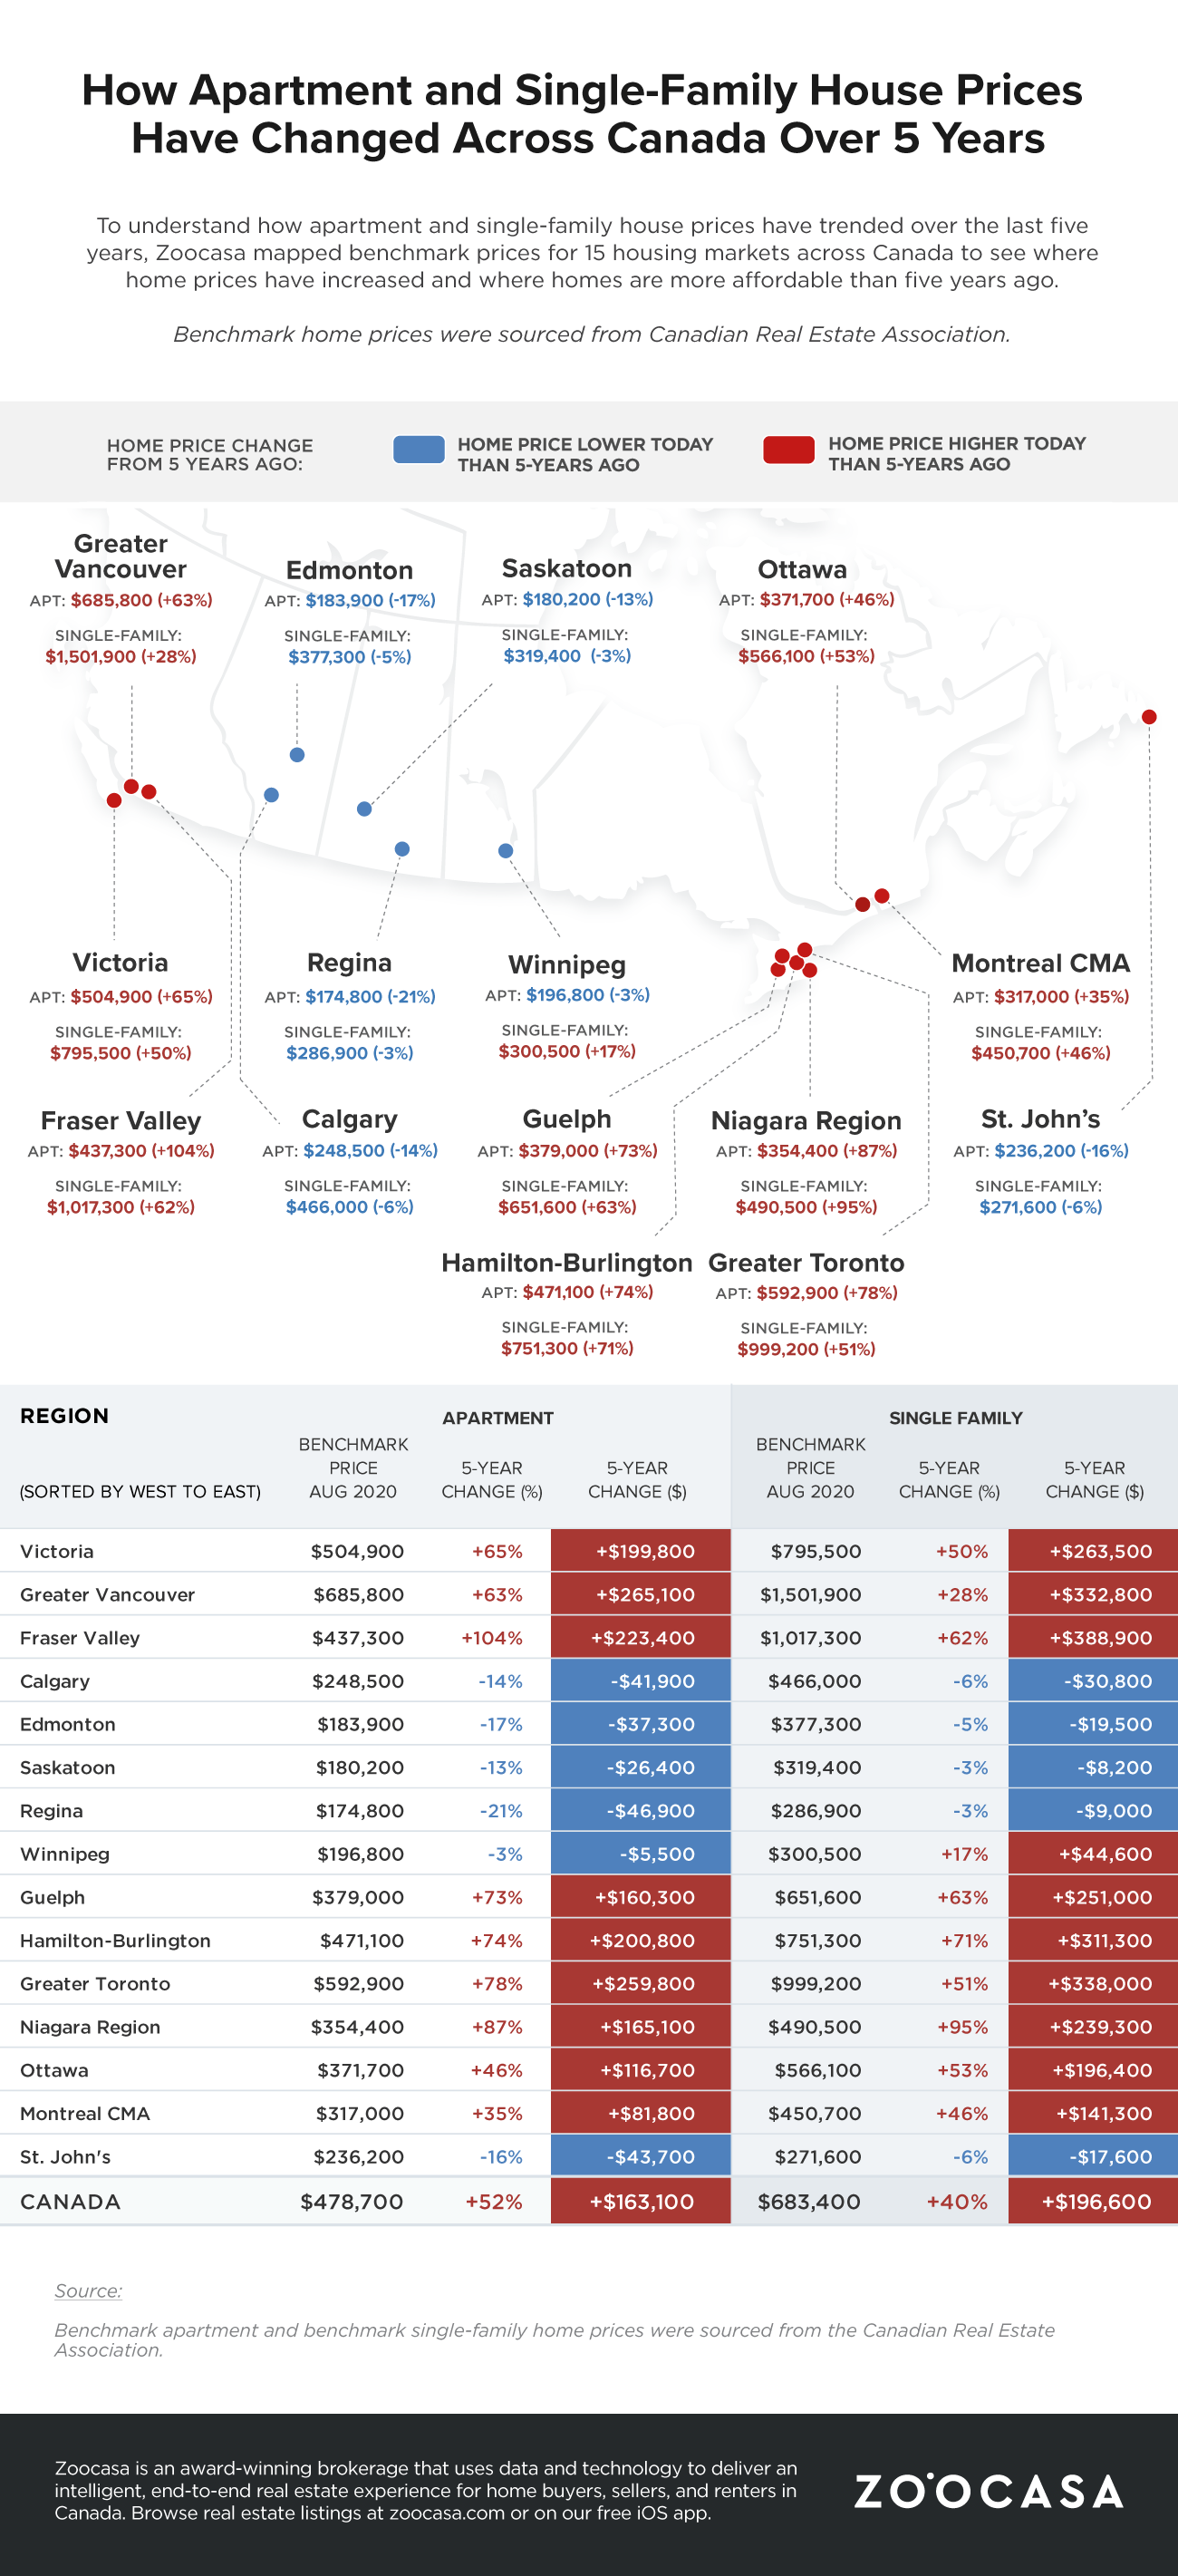
To understand how current home prices compare to the past, Zoocasa used data from the Canadian Real Estate Association (CREA) to highlight trends in benchmark home prices for apartments and single-family houses in 15 Canadian regions over the past 5 years. We highlight the extent to which benchmark home prices grew or contracted in each region, offering a glimpse at regions where housing is more or less affordable today than it was 5 years ago.
Overall, the Canadian benchmark apartment price rose a staggering 52% in 5 years, from $315,600 in August 2015 to $478,700 in August 2020. The benchmark price for single-family houses across Canada rose 40% from $486,800 to $683,400. That being said, a closer look at each area included in our analysis reveals that certain housing markets faced a much higher pace of price growth than others, with others noting benchmark price declines that resulted in housing becoming more affordable today than it was 5 years ago.
Prairie Markets Including Calgary and Edmonton More Affordable Today Than 5 Years Ago
Overall, Prairie cities offer first-time home buyers some of the best affordability in the country, with benchmark prices under $250,000 for apartments and under $500,000 for single-family houses this August. In fact, the Prairies are one of the few regions where a benchmark apartment and single-family house is more affordable today than it was 5 years ago.
In Calgary, Canada’s third most populous city, the benchmark apartment price was $248,500 in August 2020, dropping 14% or $41,900 since 2015. The benchmark single-family house in Calgary is now $466,000, which is 6% or $30,800 cheaper than the price 5 years ago. Similarly, in Edmonton, the benchmark apartment is 17%, or $37,300, cheaper than it was 5 years ago at $183,900 and the benchmark single-family house cost $377,300 in August this year, vs. $396,800 in August 2015, a drop of 5% or $19,500.
Given their proximity to the Canadian Rockies, both Calgary and Edmonton offer good opportunities for buyers with remote-working flexibility seeking greater square footage and green space. Comparatively, the benchmark apartment price in Toronto is nearly double the price of the benchmark apartment in Calgary, and the benchmark single-family house in Toronto is more than double Calgary. Additionally, both Calgary and Edmonton have a much lower population density at approx. 1,900 people per square kilometer in Calgary and 1,400 people per square kilometer in Edmonton versus 4,700 people per square kilometer in Toronto.
Elsewhere in the Prairies, compared to 5 years ago, the benchmark apartment price is 21% lower in Regina ($174,800), 13% lower in Saskatoon ($180,200), and 3% lower in Winnipeg ($196,800). Compared to 5 years ago, single-family house prices are 3% lower in Regina ($286,900) and Saskatoon ($319,400), but up 17% in Winnipeg to $300,500.
Benchmark Apartment Prices Rose Over 50% in 7 Markets Over the Past 5 Years
Of the 15 markets included in our analysis, the benchmark price for apartments rose by more than 50% in 7 markets. Fraser Valley, BC, where the benchmark price increased 104% to $437,300, led the country in terms of the increase in benchmark prices for apartments over the past 5 years.
Fraser Valley was followed by a number of markets in Southern Ontario. Niagara Region led price growth in the area, with the benchmark price growing 87% to $354,400. This was followed by Greater Toronto where the benchmark price rose 78% to $592,900, Hamilton-Burlington where the price rose 74% to $471,100 and Guelph where there was a 73% increase in the benchmark apartment price to $379,000.
This was followed by Victoria, where the benchmark apartment price grew 65% to $504,900 and Greater Vancouver where it rose 63% to $685,800. Although Greater Vancouver didn’t see the highest percentage growth in benchmark apartment price, it experienced the largest increase in dollar amount at +$265,100.
Ottawa and Montreal also saw gains in the benchmark apartment price since five years ago, but at 46% and 35%, respectively.
Benchmark Prices for Single-Family Houses Grew 50% or more in 7 Regions Over the Past 5 Years
7 out of 15 markets included in our analysis also noted a 50% or higher increase in the benchmark price for single-family houses.
Niagara Region experienced the highest growth, with the benchmark price for single-family houses almost doubling, with a staggering 95% increase in 5 years to $490,500. This was followed by Hamilton-Burligton (71%), Guelph (63%), Fraser Valley (62%), Ottawa (53%), Greater Toronto (51%), and Victoria (50%).
Montreal, Greater Vancouver and Winnipeg single-family benchmark prices also rose, but at 46%, 28% and 17% respectively.
Our infographic below maps and compares benchmark prices for apartments and single-family houses for each region included in our analysis in August 2020 and August 2015, noting the extent to which prices changed in each region. Further below, find a list of the top regions where it is cheaper to buy an apartment and a single-family house today than it was 5 years ago, and a list of the regions where benchmark prices for apartments and single-family houses have risen the most since August 2015.
Top 3 Regions Where it’s Cheaper to Purchase the Benchmark Apartment Today vs. 5 Years Ago (Based on %)
1. Regina
Benchmark Apartment Price, August 2020: $174,800
5-Year % Difference: -21%
5-Year $ Difference: -$46,900
2. Edmonton
Benchmark Apartment Price, August 2020: $183,900
5-Year % Difference: -17%
5-Year $ Difference: -$37,300
3. St. John’s
Benchmark Apartment Price, August 2020: $236,200
5-Year % Difference: -16%
5-Year $ Difference: -$43,700
Top 3 Regions Where it’s Cheaper to Purchase the Benchmark Single-Family House Today vs. 5 Years Ago (Based on %)
1. Calgary
Benchmark Single-Family House Price, August 2020: $466,000
5-Year % Difference: -6%
5-Year $ Difference: -$30,800
2. St John’s
Benchmark Single-Family House Price, August 2020: $271,600
5-Year % Difference: -6%
5-Year $ Difference: -$17,600
3. Edmonton
Benchmark Single-Family House Price, August 2020: $377,300
5-Year % Difference: -5%
5-Year $ Difference: -$19,500
Top 3 Regions Where it’s More Expensive to Purchase the Benchmark Apartment Today vs. 5 Years Ago (Based on %)
1. Fraser Valley
Benchmark Apartment Price, August 2020: $437,300
5-Year % Difference: +104%
5-Year $ Difference: +$223,400
2. Niagara Region
Benchmark Apartment Price, August 2020: $354,400
5-Year % Difference: +87%
5-Year $ Difference: +$165,100
3. Greater Toronto
Benchmark Apartment Price, August 2020: $592,900
5-Year % Difference: +78%
5-Year $ Difference: +$259,800
Top 3 Regions Where it’s More Expensive to Purchase the Benchmark Single-Family House Today vs. 5 Years Ago (Based on %)
1. Niagara Region
Benchmark Single-Family House Price, August 2020: $490,500
5-Year % Difference: +95%
5-Year $ Difference: +$239,300
2. Hamilton-Burlington
Benchmark Single-Family House Price, August 2020: $751,300
5-Year % Difference: +71%
5-Year $ Difference: +$311,300
3. Guelph
Benchmark Single-Family House Price, August 2020: $651,600
5-Year % Difference: +63%
5-Year $ Difference: +$251,000
Sources
Benchmark apartment and benchmark single-family house prices were sourced from the Canadian Real Estate Association.
Data use to calculate population density was sourced from Calgary Economic Development, City of Edmonton and City of Toronto.
Contact
For more information about this report or to set up a media interview, please contact communications@zoocasa.com.