Zoocasa
Sold Prices
Map
Market Insights
  • Blog Home
  • For Buyers
  • For Sellers
  • Real Estate News
  • Mortgage News in Canada
  • Free Guides (PDF)
  • Real Estate Infographics
Zoocasa
  • Blog Home
  • For Buyers
  • For Sellers
  • Real Estate News
  • Mortgage News in Canada
  • Free Guides (PDF)
  • Real Estate Infographics
Home Affordability Reports

Toronto Neighbourhoods with the Shortest Days on Market [INFOGRAPHIC]

Penelope Graham by Penelope Graham
May 29, 2018
in Affordability Reports, Infographics, Real Estate News
Reading Time: 3 mins read
Toronto neighbourhoods with the shortest days on market
Share19
Tweet
Share
19 Shares

In the year following the Fair Housing Plan, some Toronto neighbourhoods have remained hot sellers’ markets – but that’s not necessarily the case everywhere in the 416. While around-the-block open house lineups are commonplace in some neighbourhoods, listings languish with nary an offer in others.

The number of days a home remains for sale is an important metric when gauging the level of competition in a given market. In addition to the average sale price, number of sales, and the sales-to-new-listings ratio (which determines whether a market is within buyers’ or sellers’ territory), there’s a lot both buyers and sellers can glean from the length of time a listing remains active.

Related Read: Best and Worst Ontario Cities for Home Affordability

What Does Average Days on Market (DoM) Mean?

Simply put, the “days on market” (DoM) refers to the length of time a listing remains active on MLS before it is sold in a firm deal. The aggregate DoM for a group of homes in a specific area, over a certain timeframe, can also be calculated by adding up all the active days for all the homes for sale, and dividing that by the number of listings. Generally, a shorter average DoM indicates a sellers’ market, while a longer DoM suggests buyers’ market conditions.

The DoM also provides both buyers and sellers important insights for individual properties; a seller can use it to determine whether their listing is performing well in comparison to similar properties, while buyers can see whether the home has generated a lot of interest thus far.

A longer DoM may also suggest the sellers are in a position to negotiate, as the homes that linger on MLS can, in some instances, develop a stigma – buyers may think there’s something wrong with the home, and submit a lower offer, or pass on it altogether. This can be especially acute in the Toronto real estate market, where incredibly tight inventory means leftover homes stick out like a sore thumb.

In fact, DoM can be so important that a common strategy for sellers of overlooked homes is to pull their listing from the market altogether, reassess their marketing and pricing strategy, and relist at a later date, with a new MLS ID (and often a new price) to seize the chance to get back in front of buyers with a seemingly fresh listing.

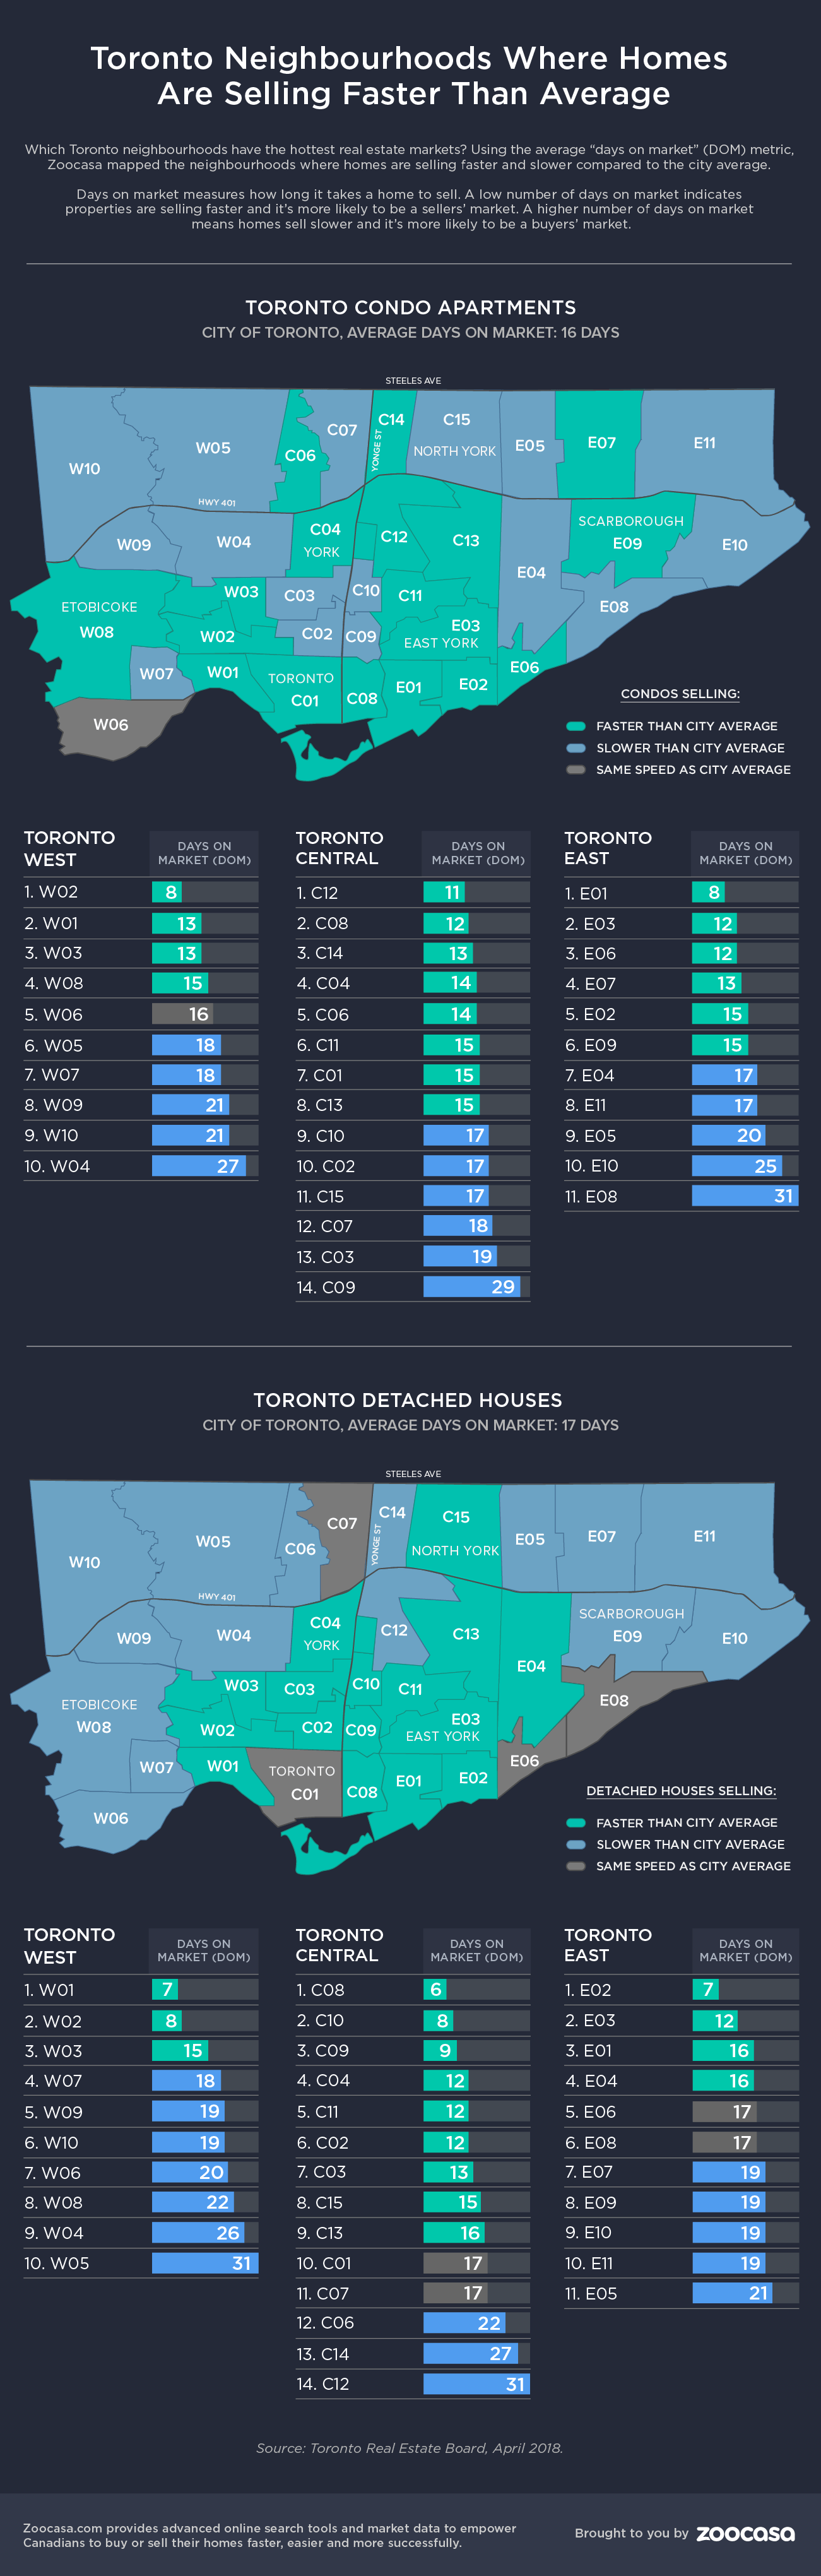
Which Toronto Neighbourhoods Have the Shortest and Longest DoMs?

To identify the 416 neighbourhoods where homes are moving at the fastest clip, Zoocasa compared each area to the city average, which was 16 days in April, according to data released by the Toronto Real Estate Board.

The numbers reveal homes are moving at a slower pace compared to the same time last year: on average, condos are taking eight days longer to sell at a total of 18, while detached homes require an additional 13 days than they did in 2017, at a total of 22 DoM.

toronto-days-on-market-zoocasa

Fastest-Selling Toronto Neighbourhoods Compared to 2017

Condos:

1: E06 – 12 DoM (-64%)

2: E02 – 15 DoM (-40%)

3: C02 – 17 DoM (-37%)

4: C04 – 14 DoM (-22%)

5: W03 – 13 DoM (-13%)

Detached Houses:

1: W01 – 7 DoM (-30%)

2: E02 – 7 DoM (-13%)

(TIE) 3: W02 – 8 Dom (0%)

(TIE) 3: C02 – 12 Dom (0%)

4: C04 – 12 DoM (9%)

5: C09 – 9 DoM (13%)

Slowest-Selling Toronto Neighbourhoods Compared to 2017

Condos:

1: E08 – 31 DoM (+520%)

2: C03 – 19 DoM (+171%)

3: E05 – 20 DoM (+150%)

4: E10 – 25 DoM (+127%)

(TIE) 5: W04 – 27 DoM (+125%)

(TIE) 5: W07 – 18 DoM (+125%)

(TIE) 5: C07 – 18 DoM (+125%)

Detached Houses:

1: W05 – 31 DoM (+288%)

2: W04 – 26 DoM (+271%)

3: C12 – 31 DoM (+210%)

(TIE) 4: C01 – 17 DoM (+183%)

(TIE) 4: E08 – 17 DoM (+183%)

5: C06 – 22 DoM (+175%)

Previous Post

5 Steps: How to Make Your Rental Apartment Legal

Next Post

Bank of Canada Holds May Rate – but Hike is on Horizon

Penelope Graham

Penelope Graham

Penelope Graham is the Managing Editor at Zoocasa, and has over a decade of experience covering real estate, mortgage, and personal finance topics. Her commentary on the housing market is frequently featured on both national and local media outlets including BNN Bloomberg, CBC, The Toronto Star, National Post, and The Huffington Post. When not keeping an eye on Toronto's hot housing market, she can be found brunching in one of the city's many vibrant neighbourhoods, travelling abroad, or in the dance studio.

Related Posts

Buying a Home

7 Family-Friendly Neighbourhoods in Mississauga for Growing Families

March 21, 2026
family driving in car
Affordability Reports

Condo vs House: Which Was the Better Investment in Canada Over the Last 10 Years?

March 16, 2026
A woman works at a desk, focused on her laptop, surrounded by notes and tools. Below, a baby plays on a mat. The scene is busy yet warm.
Affordability Reports

How Much Does It Cost to Live in America’s Best Cities for Work-Life Balance

March 11, 2026

Blog Search

No Result
View All Result

Newsletter Sign-up

Join a community of 130,000+ subscribers. Don't miss important real estate news, market data, and buying and selling tips.

Recent Articles

7 Family-Friendly Neighbourhoods in Mississauga for Growing Families

March 21, 2026
A focused chef in a white uniform artfully garnishes a dish with herbs in an elegant restaurant kitchen, surrounded by busy staff, creating a lively atmosphere.

7 Celebrity Restaurants in Vancouver That Hollywood Stars Actually Dine At

March 20, 2026
Colorful buildings nestled by a calm bay in St. John's, Newfoundland, with green hills and blue skies, conveying a vibrant and serene coastal scene.

6 Homes in Newfoundland You Can Still Buy for Under $200K

March 19, 2026

Spring Opportunity: BoC Maintains Rate Hold, Opening a Window for Buyers 

March 18, 2026

Featured Listings

Colorful buildings nestled by a calm bay in St. John's, Newfoundland, with green hills and blue skies, conveying a vibrant and serene coastal scene.

6 Homes in Newfoundland You Can Still Buy for Under $200K

March 19, 2026
A cozy wooden cabin bedroom with a rustic log bed, deer antler decor, and horse painting. A cowhide rug adds warmth; soft light filters through curtains.

5 Cozy Winter Cabins for Sale in B.C. That Deliver Four-Season Lifestyle Value

February 24, 2026
A snowboarder performs a high jump against a bright sunlit sky in a snowy mountain landscape, capturing a thrilling and adventurous moment.

7 Homes for Olympians That Keep Winter Athletes Competition-Ready

February 5, 2026

6 Standout Homes That Are Changing the Game in Luxury Real Estate

January 30, 2026
first-time home buyer programs and rebates

Social Media

250 The Esplanade Suite 408 Toronto, ON M5A 4J5

Stay Connected

  • Blog Home
  • For Buyers
  • For Sellers
  • Real Estate News
  • Mortgage News in Canada
  • Free Guides (PDF)
  • Real Estate Infographics
No Result
View All Result

Zoocasa © 2007–2022. The trademarks MLS®, Multiple Listing Service® and the associated logos are owned by The Canadian Real Estate Association (CREA) and identify the quality of services provided by real estate professionals who are members of CREA.