
What is a sellers’ market? Describing a neighbourhood, city or region as such typically calls to mind open house lineups, hot bidding wars, and homes selling for hundreds of thousands of dollars higher than their listing price.
However, classifying an area as sellers’ territory doesn’t necessarily mean it’s an expensive market – just as a buyers’ market doesn’t always indicate affordable home prices. Rather, whether a housing market can be considered within a buyers’, sellers’ or balanced range comes down to one important metric: the sales-to-new-listings ratio (SNLR).
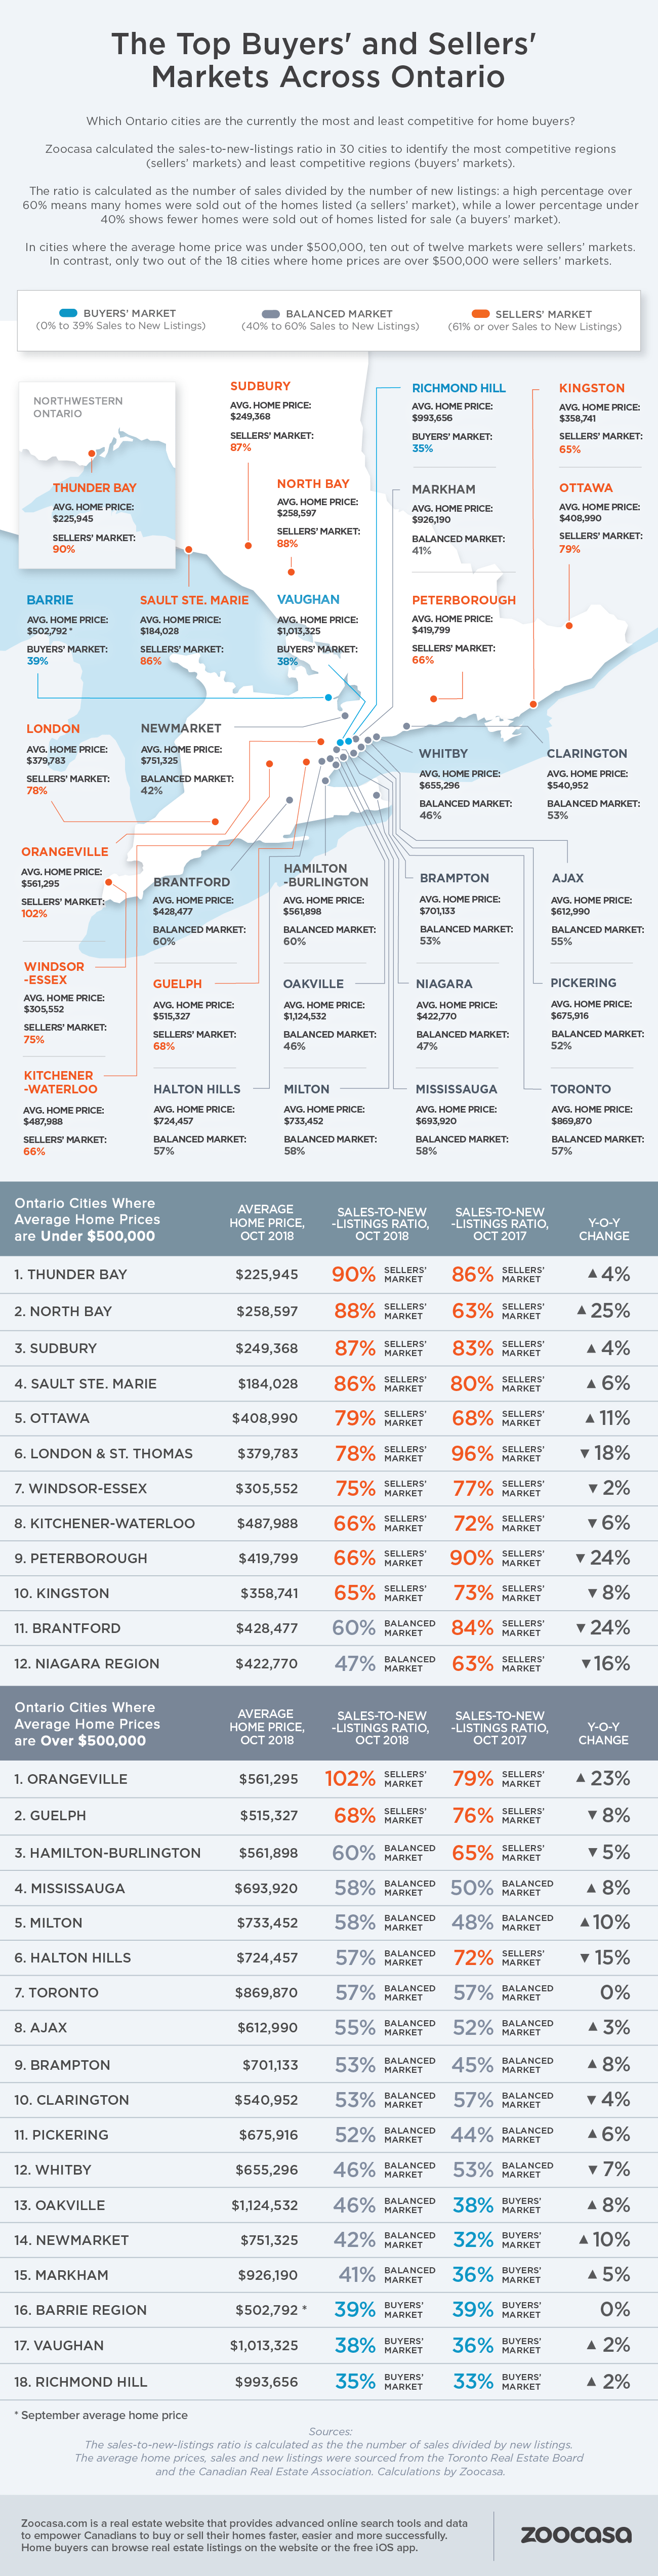
The SNLR is calculated by dividing the number of sales by the number of new listings within a specific housing market over a period of time. It reveals how many of the homes listed for sale are selling within that time frame, and sheds insight into how competitive the market is for buyers and sellers. According to the Canadian Real Estate Association (CREA), an SNLR between 40 – 60% is considered a balanced market, with below and above that threshold indicating buyers’ and sellers’ conditions, respectively.
Related Read: Top Buyers’ and Sellers’ Markets Across Canada
Why Buyers and Sellers Should Pay Attention to the SNLR
While the SNLR doesn’t always reflect how affordable a market is, it can offer valuable hints on how a market has changed over the long or short term, and whether or not it’s an advantageous time to list or purchase a home.
It can also be symptomatic of larger trends influencing the market; for example, the City of Toronto was plunged into buyers’ conditions in the months following the Fair Housing Plan as anxious sellers listed en-masse and flooded the market with new inventory, outpacing sales activity. That market has since recovered to balanced, with a ratio of 57%.
A tight sellers’ market, however, may indicate a high level of demand for a specific neighbourhood, a lower level of inventory, or simply reflect an area where homes don’t often come up for sale.
Top Sellers’ Markets Across Ontario
Overall, Ontario’s housing market can be considered balanced with a SNLR of 56%, according to CREA’s October report. However, this varies widely in markets across the province; recent data compiled by Zoocasa finds that, depending on their location, market price point, and local inventory, Ontarians face little, to very steep, competition when buying a home.
In fact, buyers face the toughest conditions in markets where the average price point is lowest: of markets where homes sell for less than $500,000, 10 of 12 municipalities could be considered sellers’ markets. Thunder Bay, where the average home cost $225,945 in October, boasts one of the steepest sellers’ markets in the province with an SNLR of 90%, as 205 of 227 newly listed homes sold within the month.
It’s a similar picture in North Bay with an SNLR of 88%, as 116 of 132 homes sold at an average of $258,597. Sudbury, where 236 of 271 homes sold, comes in third with a ratio of 87%, followed by Sault Ste. Marie, with a ratio of 86%, 162 of 189 homes sold, and an average home price of $184,028.
The only outlier within the top five is the Ottawa real estate market, which has considerably higher volumes of inventory and price point; here, 1,402 of 1,779 newly-listed homes sold in October, at an average of $408,990. CREA pointed out in its report that the city has enjoyed rampant price growth driven by migrant demand for single-detached homes at comparatively lower prices than those found within the Greater Golden Horseshoe.
The London, Ontario real estate and Kitchener real estate markets were also notable sellers’ markets, given the relatively lower price points.
Methodology
The average home prices, sales and new listings were sourced from the Toronto Real Estate Board and the Canadian Real Estate Association. Calculations by Zoocasa.
Better Balance in Pricier Markets
By contrast, there is greater balance – and even buyers’ territory – among Ontario’s priciest markets. Of those where the average home price is higher than $500,000, only three of 18 municipalities in this price point can be considered sellers’ markets.
Orangeville, where the average home price is $561,295 is actually the tightest sellers’ market in Ontario with an SNLR of 102%, with 57 home sales and only 56 new listings. That’s followed by Guelph at 68%, even though sales and new listings have both softened year over year.
Hamilton-Burlington is on the edge of balanced territory at 60%; with a relatively low home price of $561,898, it continues to be a popular draw for real estate buyers from surrounding expensive markets. Balanced conditions also prevail in Mississauga and Milton, despite higher average home prices above the $600,000-mark.