
In April 2017, the former provincial Liberal government introduced a 16-part set of measures designed to balance the Ontario housing market by cooling rampant price growth and speculative demand, and boosting rental supply.
Dubbed the Fair Housing Plan, the most notable of the new regulations included a 15% Non-Resident Speculation Tax for foreign purchasers as well as sweeping rent controls that limited annual rent increases to the provincial limit, regardless of when the unit was built.
The changes had an immediate psychological impact on the market. Local real estate boards noted a large influx of listings in the following months, as skittish sellers looked to cash in before the market went soft. As a result, a number of housing markets within the province experienced double-digit per-cent price and sales declines, especially among higher-priced single-family home types.
Since then, a change in provincial leadership has led to a partial repeal of the regulations, as the current Conservative government dialed rent controls back to apply only to units created before November 15, 2018, and increased focus on housing creation via its Housing Supply Action Plan. It’s also important to note the federal mortgage stress test which was implemented on January 1, 2018; requiring borrowers to qualify at a rate roughly 2% higher than their actual mortgage, it effectively reduced purchasing power for home buyers and contributed to chilling sales at all levels of the market.
Now, two years after the introduction of the FHP, how has the dust settled across various Ontario markets? To find out, Zoocasa sourced sold home prices and sales-to-new-listings ratios (
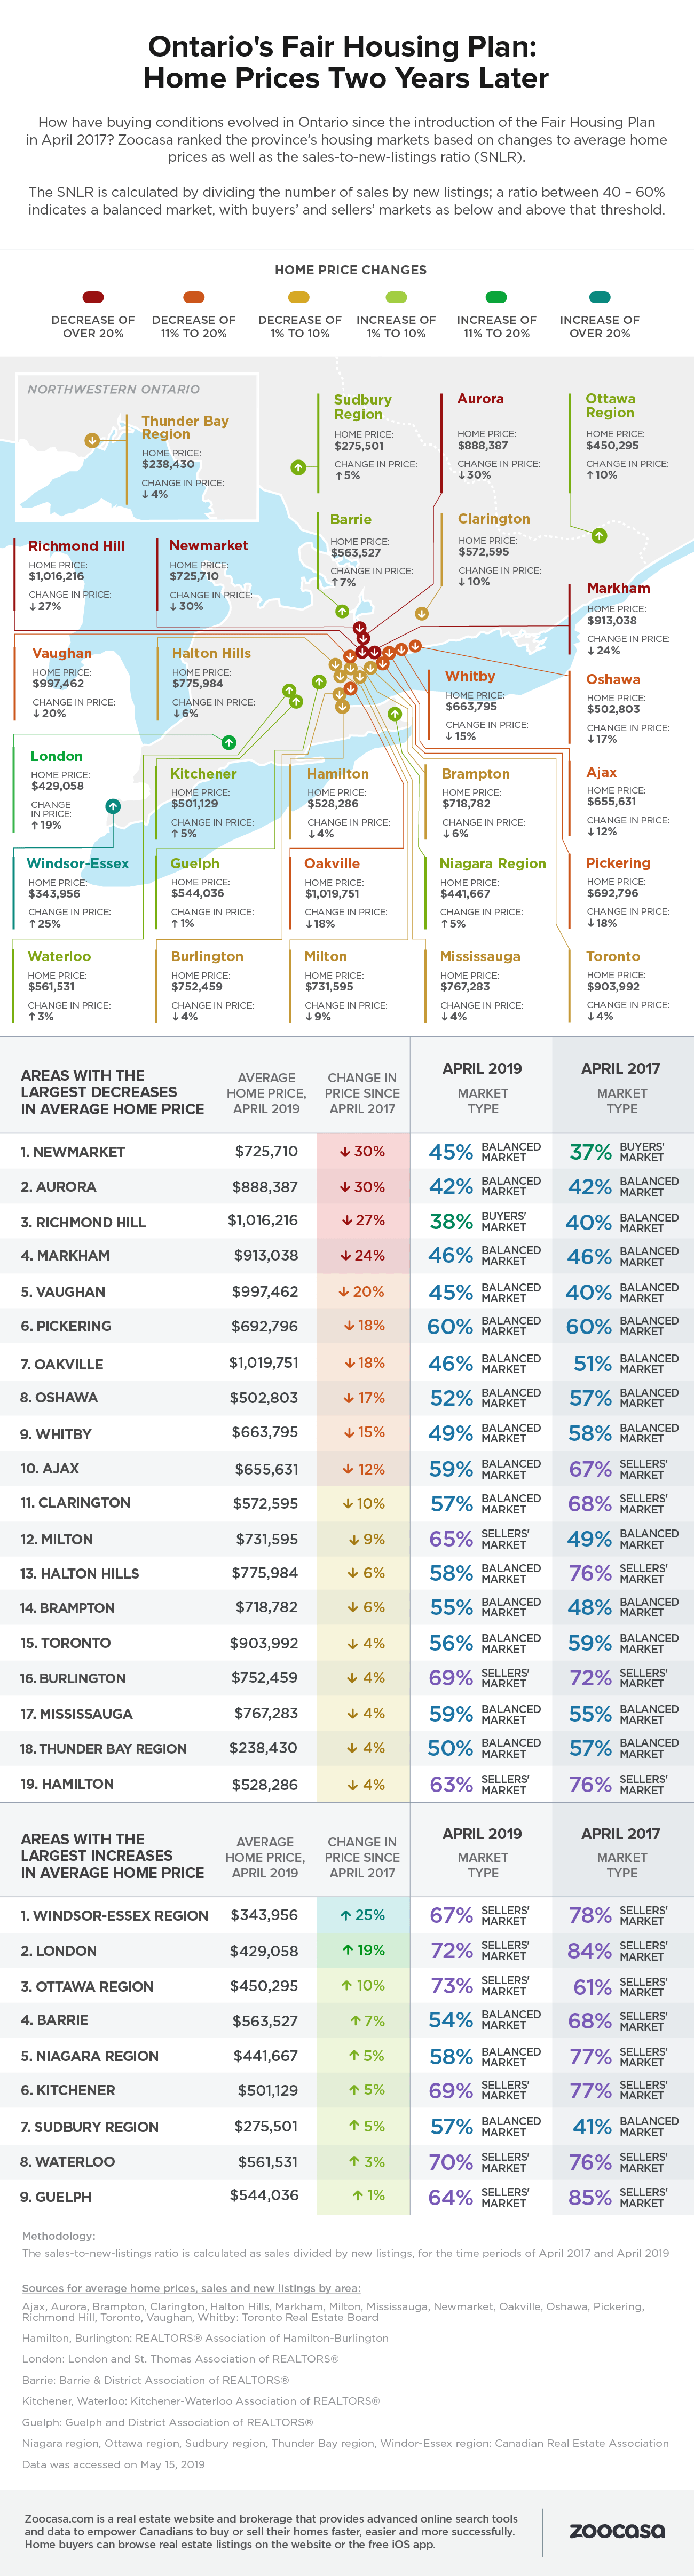
York Region Home Prices Hardest Hit
The numbers reveal some municipalities – especially those in higher-priced York Region – have sustained steep declines in prices and considerable change in buying conditions over the two-year period.
According to the data, Newmarket has absorbed the greatest declines in sale price from April 2017, declining -30% to $725,710 – a dramatic dip below the $1-million mark that used to be the norm in that market. However, while sales have fallen -31%, market conditions have actually tightened over the two-year time frame due to a deeper contraction in listings, which are down -42%. That’s led to an SNLR of 45% – a balanced market, and an improvement from 37% in 2017, which indicated buyers’ conditions.
The city of Aurora experienced the second-largest price decline of -30%, also dipping below $1 million to an average of $888,387. Sales fell -35%, on par with a -34% decline in new listings, leaving the SNLR and buyer conditions unchanged at 42%. Richmond Hill rounds out the markets with the steepest drops, as the average price fell -27% to $1,016,216. A -25% decrease in sales has outpaced a -21% contraction in new listings, pulling the market into buyers’ territory with an
Southern Ontario and Ottawa Markets Continue to Grow
Several Ontario markets, however, have weathered the new regulations with greater success, especially comparatively affordable secondary markets that are supported by strong employment; the markets with the greatest price increases over the last 24 months all have average home prices below $500,000.
While sales in the Windsor-Essex region have remained flat and new supply surged by 16%, the market remains in steep sellers’ territory with an SNLR of 67%. That’s continued to put upward pressure on prices, which have increased by 25% to $343,956. It’s a similar scenario for London homes for sale, which have experienced hot price growth with average home values up 19% to $429,058 despite a -16% drop in sales and -3% dip in listings; an SNLR of 72% has kept the market steeply competitive for buyers, as little supply prompts bidding wars.
The Ottawa real estate market, which has been one of the top performing regions in recent months, remains untouched by any correction with prices and sales both up by a robust 10%, and listings tightening by -6%. That’s led to an SNLR of 73% – a sizzling sellers’ market – and a rapidly rising average home price of $450,295.
Check out how prices and market conditions have changed across Ontario between April 2017 and 2019 in the infographic below:
Top 3 Markets with Largest Price Decreases
1 – Newmarket
April 2019 Average Price: $725,710 (-30%)
April 2019 Sales: 135 (-31%)
April 2019 New Listings: 302 (-42%)
April 2019 SNLR: 45% (Balanced)
2 – Aurora
April 2019 Average Price: $888,387 (-30%)
April 2019 Sales: 99 (-35%)
April 2019 New Listings: 237 (-34%)
April 2019 SNLR: 42% (Balanced)
3 – Richmond Hill
April 2019 Average Price: $1,016,216 (-27%)
April 2019 Sales: 252 (-25%)
April 2019 New Listings: 664 (-21%)
April 2019 SNLR: 38% (Buyers’)
Top 3 Markets with largest Price Increases
1 – Windsor-Essex
April 2019 Average Price: $343,956 (+25%)
April 2019 Sales: 694 (0%)
April 2019 New Listings: 1,032 (+16%)
April 2019 SNLR: 67% (Sellers’)
2 – London
April 2019 Average Price: $429,058 (+19%)
April 2019 Sales: 709 (-16%)
April 2019 New Listings: 983 (-3%)
April 2019 SNLR: 72% (Sellers’)
3 – Ottawa Region
April 2019 Average Price: $450,295 (+10%)
April 2019 Sales: 2,052 (+10%)
April 2019 New Listings: 2,803 (-7%)
April 2019 SNLR: 73% (Sellers’)
About Zoocasa
Zoocasa.com is a tech-driven brokerage that empowers Canadians to make more informed real estate decisions. Our proprietary home search tools and streamlined agent experience make buying and selling homes smarter, faster and more successful. Home buyers can browse real estate listings on the website or the free real estate iOS app.
For more information about this report or to set up a media interview, please email [email protected].