Temperatures are slowly rising throughout the Greater Toronto Area, coaxing buyers back into the real estate game within the first two weeks of March. While overall market conditions remain between 30 – 49 per cent below 2017’s rampant activity, demand is increasing month over month, signalling a strong spring is on the way.
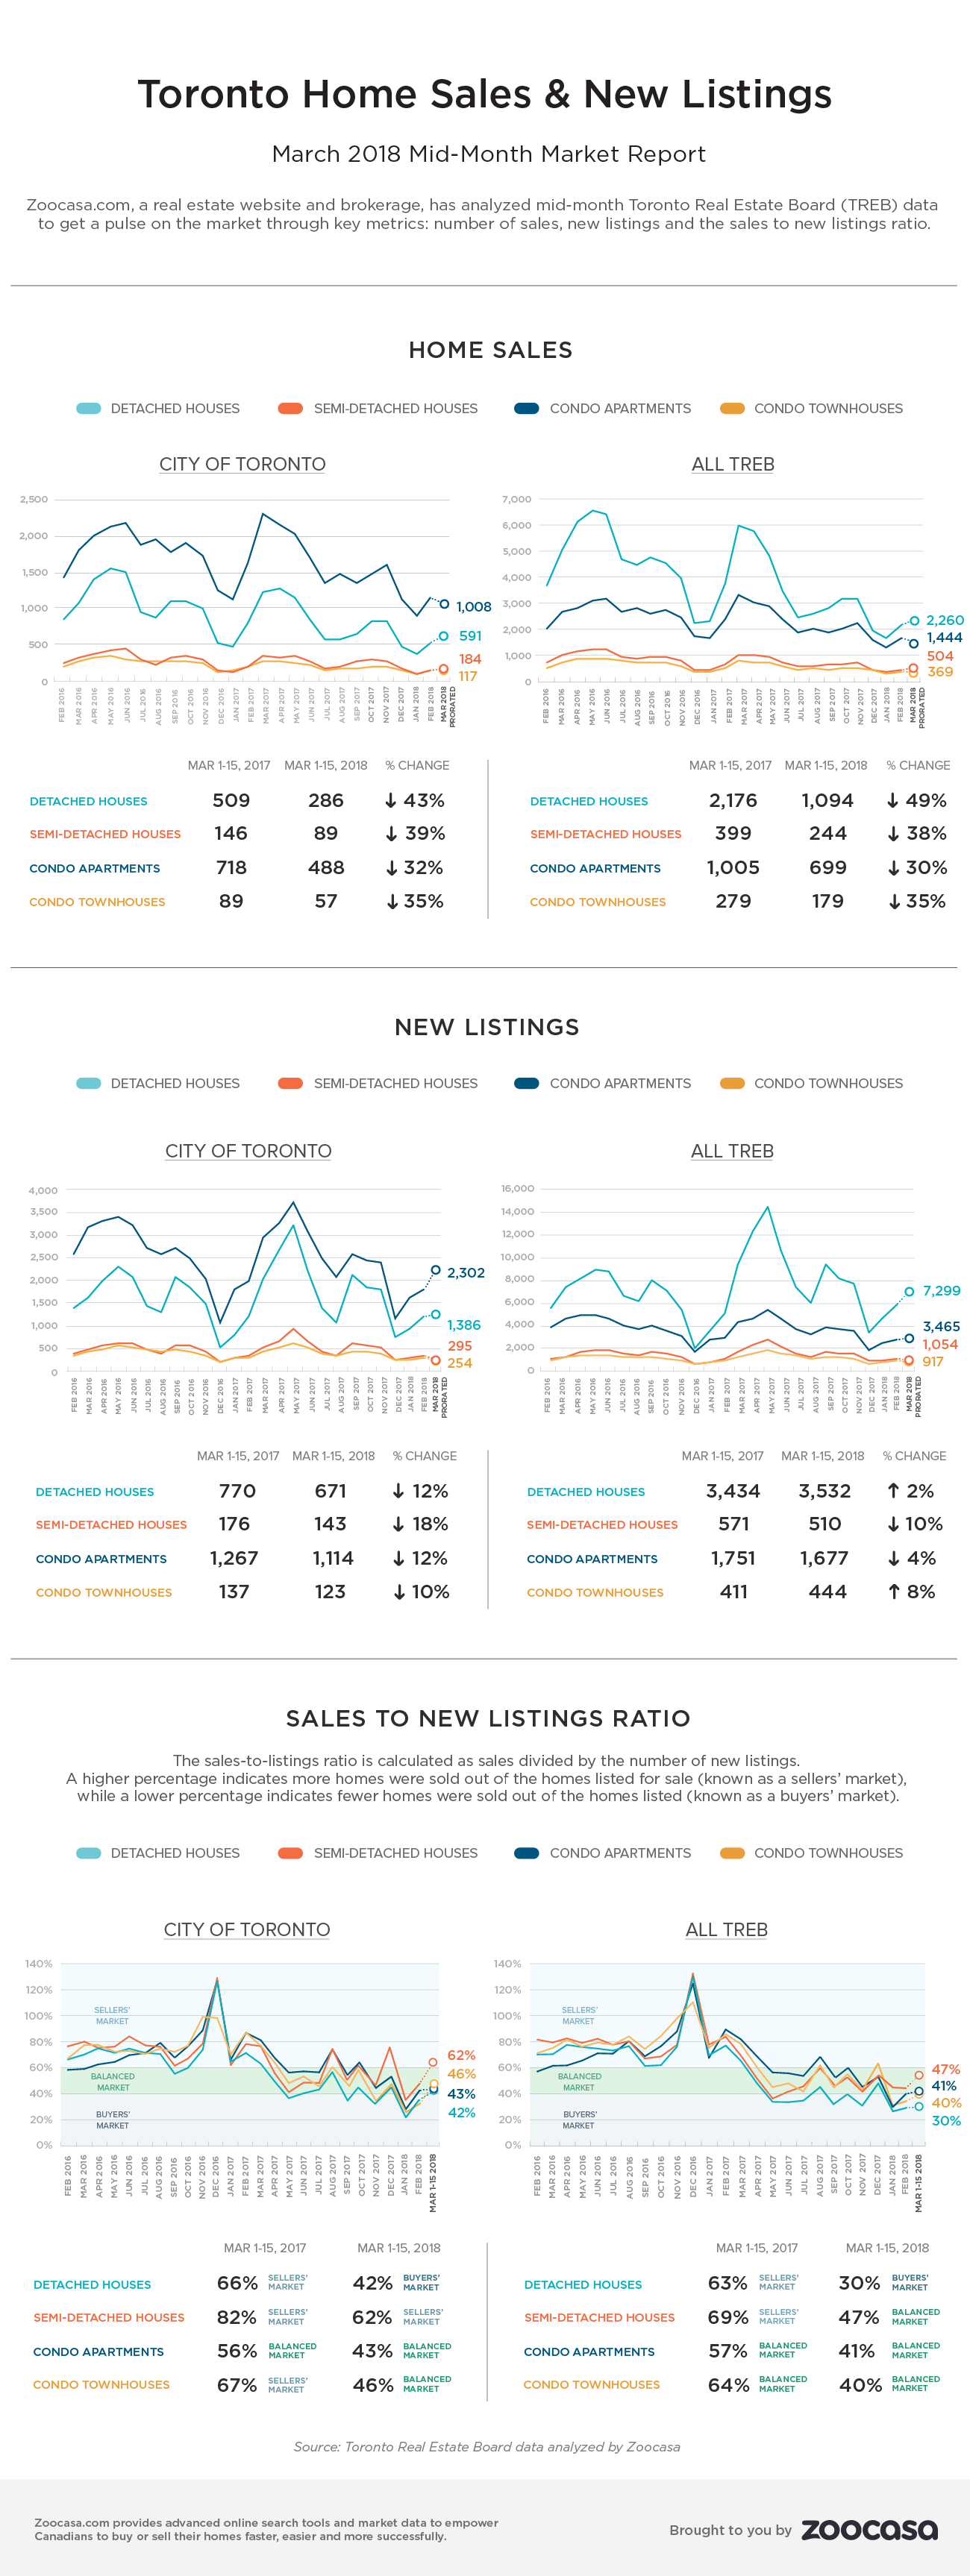
According to mid-month data compiled by Zoocasa from the Toronto Real Estate Board, sales are up across all home types from the same period in February, with growth 35 – 67 per cent higher in the TREB region, and 38 – 67 per cent within the City of Toronto proper.
Buyers also had slightly less selection at the start of the month for condos and semi-detached homes, which both fell 4 per cent and 10 per cent from last year’s inventory levels. However, there are a greater number of detached homes and townhouses for sale, up 2 and 8 per cents, respectively.
The market remains in balanced territory in the TREB region with a sales-to-new-listings ratio of 47 per cent, though conditions have tightened within the 416, with a ratio of 62 per cent. This ratio, which is calculated by dividing the number of sales by the number of new listings over a specific time period, gauges the level of competition within a market; a ratio between 40 – 60 per cent is considered balanced, with below and above that threshold indicating buyers’ and sellers’ markets.
Related Read: These Toronto Neighbourhoods are now Buyers’ Markets
Check out how the first two weeks of March 2018 compare with the same time period last year.
Mid-Month March Home Sales: 2018 vs. 2017
Condo: Still in Balance
The demand for condos has steadily grown in the first few months of 2018, as new mortgage qualification rules hamper affordability and reduce homeownership expectations for many buyers. While year-over-year sales are down 30 per cent in the TREB region (with 699 units sold compared to 1,005 in 2017), and down 32 per cent in the 416 (488 units vs. 718), February-to-March activity reveals healthy increases of 35 and 38 per cents.
However, that increase in demand has been tempered by an influx of new supply, with 31- and 34-per-cent more units listed for sale month over month. As a result, buying conditions have remained relatively flat and balanced, with a ratio of 41 per cent in the TREB region (up from 40 per cent in February), and 43 per cent in the 416 (from 42 per cent last month.
Condo Townhouses: No Longer a Buyers’ Market
A relatively small segment compared to other home types, condo townhouses have seen some of the most extreme variations in supply and demand. Year-over-year sales have plunged 35 per cent in both the TREB (179 vs. 279 in 2017) and 416 regions (57 vs. 89 in 2017). While there were 10 per cent fewer units listed in the city, the overall GTA actually saw an 8-per-cent increase in availability compared to this time last year.
In comparison, February-to-March sales surged 67 per cent in both regions (179 and 57), with new listings up a hefty 51 per cent in the GTA and a more moderate – but still impressive – 26 per cent in the 416.
General market conditions have tightened from a buyers’ market in February to balanced in March, with ratios of 46 and 35 per cent, respectively.
Detached Homes: Demand Heats Up for City Houses
All eyes have been on the detached segment, as once-behemoth demand appears to have drastically cooled from last year’s record-breaking activity. Sales have fallen 49 and 43 per cent in the TREB and 416 regions, while new inventory has ticked 2 per cent higher in the GTA and down 12 per cent in the city. That has kept the larger territory submerged in a technical buyers’ market, with a ratio of 30 per cent, though steeper demand in the 416 has firmed conditions up to balanced at 42 per cent.
However, buyers aren’t sleeping on their detached purchases, if the month-over-month data is any indication. Demand is up a robust 48 and 44 per cent from February, with 1,094 and 286 sales in TREB and the 416, respectively. A 44-per-cent increase in new listings in the TREB area matched that of increased demand, while just 26 per cent more homes came to the Toronto market in March.
Semi-Detached Houses: Still a Sellers’ Market
Compared to 2017, sales for semi-detached homes are down 38 per cent at 244 sold in the TREB region, and 39 per cent within the 416, with just 89 homes changing hands. New listings have eased 10 per cent and 18 per cent, slightly offsetting cooler demand.
Demand has returned with a vengeance in March, though, with sales up 53 and 64 per cent in February and new listings increasing 37 and 64 per cent. Month-over-month conditions also tightened slightly, with the GTA market remaining in balanced territory with a ratio of 47 per cent, and the 416 entering a sellers’ market, at 62 per cent.