
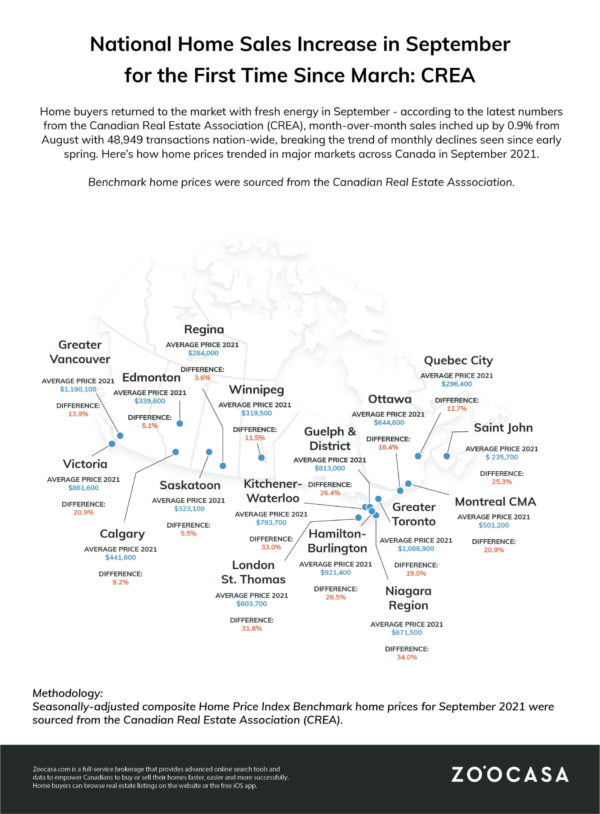
Home buyers returned to the market with fresh energy in September – according to the latest numbers from the Canadian Real Estate Association (CREA), month-over-month sales inched up by 0.9% from August with 48,949 transactions nation-wide, breaking the trend of monthly declines seen since early spring.
However, 2020 remains an unprecedented year for buyer activity; this September, while the second-strongest on record, still came in -17.5% below last year in terms of sales. That’s largely due to a persistent shortage in supply, according to CREA’s analysts. A total of 65,211 new listings were brought to market over the course of the month, down -1.6% from August and lagging -19.6% below last September.
Too Few Listings Push Home Prices Higher Across the Nation
That’s fueling an ongoing supply-and-demand imbalance with steep sellers’ market conditions in roughly 60% of all local markets, and a national Sales-to New-Listings Ratio (SNLR) of 75.1%. This ratio, which measures the level of competition in the market, is calculated by dividing the number of sales by the number of new listings; a range between 40 – 60% is considered a balanced market, with above and below that threshold indicating sellers’ and buyers’ markets, respectively.
Canada’s SNLR has increased over both the short- and long-term, up from a ratio of 73.2% in August and well above the historical average of 54.8%. As a result, inventory sits at a record-low 2.1 months (less than half the long-term average of over five months).
All this translates into higher home prices in markets, big and small, across Canada – the national average home price rose 13.9% year over year to $686,650, while the Home Price Index, which measures the most typical type of home sold, increased by 21.5% annually, and up 1.7% month over month.
Related Read: GTA Home Prices Push the $1.1-Million Mark in September
CREA Chair Cliff Stevenson says that while the September numbers are indicating the market is starting to settle from its sheer ups and downs during the pandemic, that tough conditions for buyers are becoming the norm is worrisome.
“September provided another month’s worth of evidence from all across Canada that housing market conditions are stabilizing near current levels,” he stated in CREA’s September release. “In some ways that comes as a relief given the volatility of the last year-and-a-half, but the issue is that demand/supply conditions are stabilizing in a place that very few people are happy about. There is still a lot of demand chasing an increasingly scarce number of listings, so this market remains very challenging.”
Check out the infographic below to see how benchmark home prices performed in major markets across Canada in September:
@zoocasa Does your city beat out #torontotiktok? #guelphtok #londonontario #kitchenerwaterloo #hamiltontok #fyp #foryou #realestatecanada
Ontario Price Gains Strongest in “18-Hour” Cities and Smaller Towns
As has been the case throughout the pandemic, the strongest pace of price growth has been in smaller cities and towns outside of major urban centres. In Ontario specifically, price growth has hovered around 25% – though slightly lower than that in the Greater Toronto Area and Ottawa. Let’s take a look at how the market performed in the province’s busiest markets.
Seller’s Market Conditions Stick Around in Greater Toronto
Despite experiencing slightly slower price growth than in surrounding communities, Toronto-area buyers are still in for the largest sticker shock: the benchmark home price has risen 19% from September 2020 to $1,086,900. This is fueled largely by the decline in new supply – a total of 11,370 listings came to market over the course of the month, down -5.7% from August, and -34% year over year. Combined with a slight 0.7% month-over-month uptick in sales (at a total of 8,711 transactions), that’s pushed the local SNLR up to 76.6%, a whopping 10% increase from last year.
Check out the latest homes for sale in Toronto:
Ottawa Chills Slightly From 2020 Levels – But Not Enough to Cool Prices
While Ottawa remains in a tight sellers’ market with an SNLR of 72.9%, conditions are slightly calmer than they were last year, when the ratio sat at a sizzling 83.6%. However, that’s cold comfort to home buyers who continue to grapple with extremely short supply and dwindling affordability.
A total of 2,602 new listings were introduced in September, down -0.9% from August, and -22.6% from 2020. Meanwhile, buyer activity saw a small monthly uptick with 1,504 homes trading hands (+2.9% MoM and -31.1% YoY). All those factors combined have kept the benchmark price propped up at $644,600: an increase of 16.4% year over year, though flat from last month.
Check out the latest homes for sale in Ottawa:
Home Prices Reach New Heights in Kitchener-Waterloo
Back in the spring of 2017, the former provincial Liberal government was spurred to take action when GTA home prices rose 33% in the course of a year. The same scorching appreciation has taken place in the Kitchener-Waterloo region over the past 12 months, with the benchmark home price reaching $793,700.
This has been fueled in part by a -10.6% drop in new listings compared to the same time last year, keeping the market firmly tethered to a seller-friendly environment; the local SNLR is 76%, up 3.7% to August, and 5.6% from 2020. Tight inventory has also acted to constrain sales, which have experienced a sharp year-over-year decline of 43.4%, with 501 transactions.
Check out the latest homes for sale in Kitchener:
Hamilton-Burlington Has One of the Hottest Sellers’ Markets Around
Hamilton-Burlington remains in a highly-competitive sellers’ market, featuring one of the highest SNLRs in the Golden Horseshoe at 84.5%. That’s been pushed up by 7% from August due to a -4.9% monthly drop in new listings; just 1,362 were brought to market over the course of September. From an annual perspective, new supply is down -27%.
Meanwhile, market pressure amped up as sales increased 3.7% from August, with 1,151 transactions. However, as is in line with the rest of the region, activity lags last year’s by double digit percentages, down -30.3%, indicative that short supply is constraining buyer activity, rather than a lack of interest.
As a result, the Hamilton benchmark price is approaching that of Toronto’s, heating 26.5% year over year to $921,400.
Check out the latest homes for sale in Hamilton:
Prices Soar In The London-St. Thomas Region
Home prices continued to rise sharply in the London-St. Thomas market in September, with the benchmark increasing 31.6% from 2020 to $603,700. This is consistent with booming price growth seen in similar-sized markets across the province, which tend to have comparably lower price points than major urban centres.
Sales lagged below last September’s levels by -10% with 894 transactions, though activity stayed roughly flat from August. It was the drop in new listings, which outpaced that of sales, that contributed most to tight market conditions in the area; a total of 1,076 homes were brought to market, down -5% from August and -4.7% year over year. That has led to one of the highest sellers’ markets in the province, with an SNLR of 83%, up 6.7% from the previous year.
Check out the latest homes for sale in London:
Thinking of selling your home? Check out Zoocasa’s Seller’s Guide!