June was a quieter period for national real estate sales, following several months of improvement during the spring season. The number of homes changing hands was fairly flat from a national perspective, as a drop in sales in half of local markets offset increases in others, according to the Canadian Real Estate Association.
Overall, home sales edged up just 0.3% from the same time period in 2018, and slipped 0.2% from May’s activity. That marks a 10% recovery from February levels, when they hit a six-year low, but are still behind the searing pace set between 2015 – 2017.
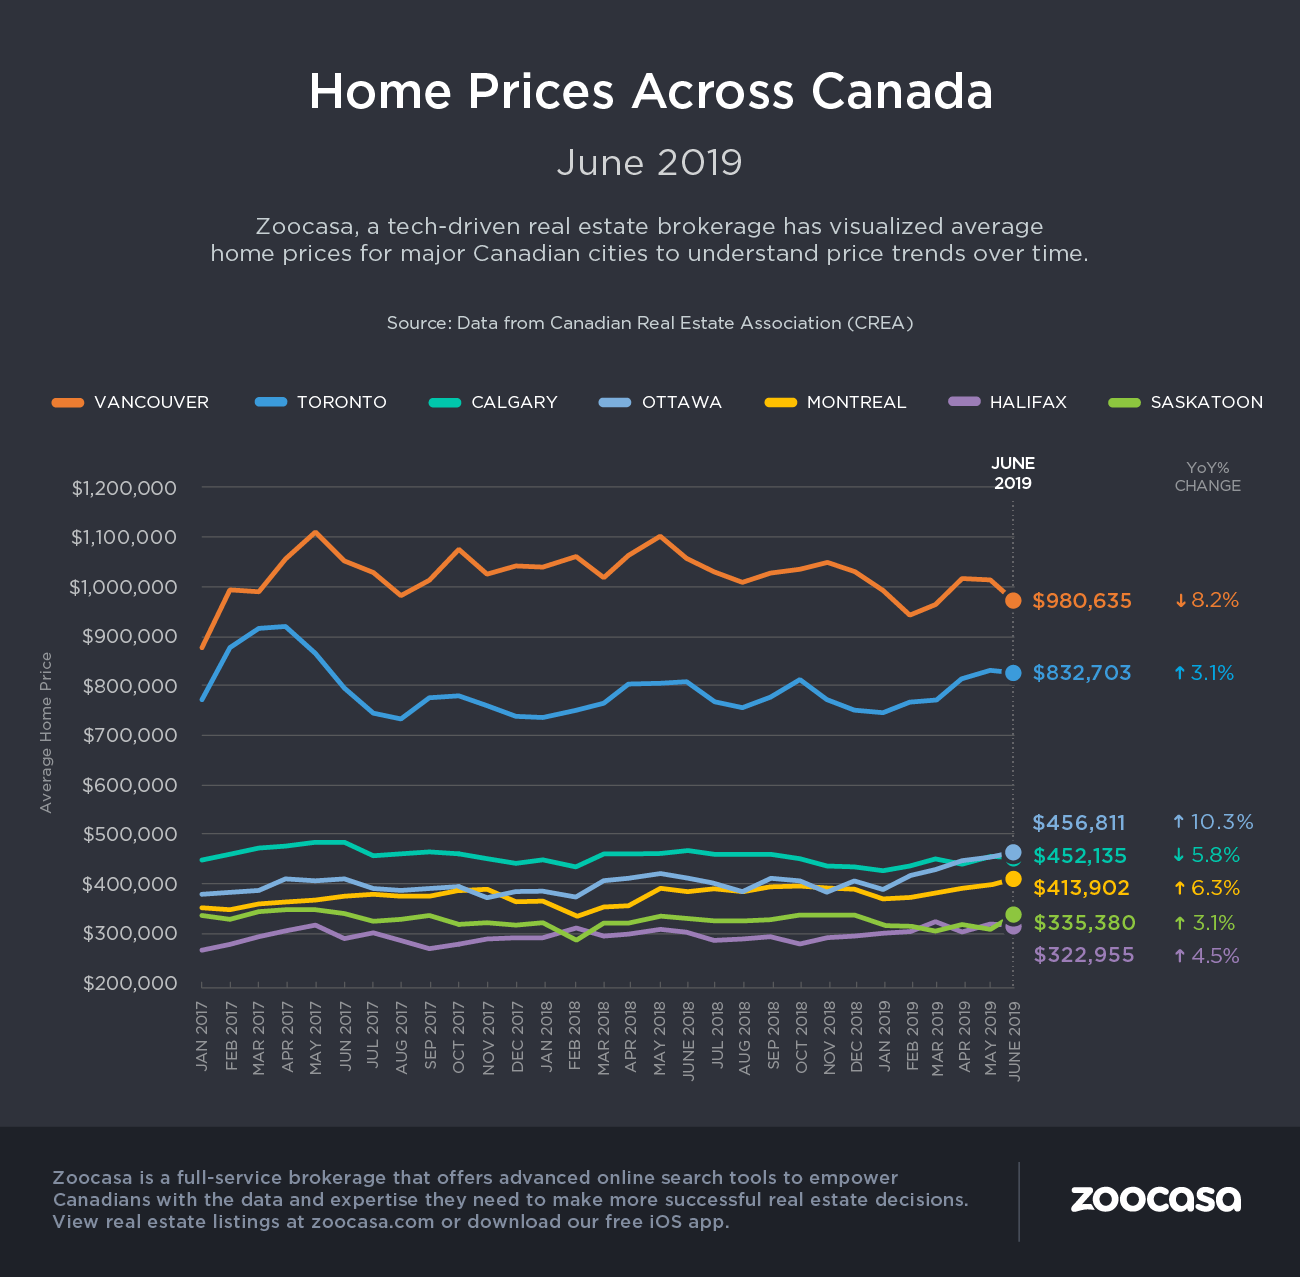
In turn, the average national sale price rose 1.7% to $505,500, while the Home Price Index – a measure of the value of homes sold – slipped 0.3% year over year, dragged lower by sluggish activity in Greater Vancouver, Calgary, and Halifax-Dartmouth. However, strong demand in Quebec and Southern Ontario kept the average up.
Slower BC Sales Pull National Average Down
Softer conditions in several larger BC markets caused benchmark prices for all home types to fall for the second month in a row; two-storey single-family homes saw values slip -0.1%, while one-storey single-family homes dropped the most, by -0.8%. Townhouse and rowhouse prices were down -0.7%, while apartments – typically the strongest-performing housing segment – saw values dip by -0.4%.
The number of new MLS listings was also flat year over year, but slightly outpaced sales with a 0.8% increase, which has modestly softened buying conditions with a sales-to-new-listings ratio (SNLR) of 57.1%. That’s well within balanced territory though down slightly from 57.7% in May. Overall, the ratio remains
Most Markets Remain Balanced
The SNLR measures the level of competition in a housing
According to this metric, 80% of housing markets in Canada can be considered balanced. Total inventory – the length of time it would take to completely sell off all available homes for sale – hovered at five months in June. That’s the lowest number since January 2018, but not too far off from the long-term average of 5.3 months.
Gap Widening Between Western and Eastern Markets
CREA’s analysts continue to point to a widening chasm in sales and price trends across the nation.
“There’s a growing divergence in Canadian housing market trends between eastern and western Canada,” stated Gregory Klump, CREA’s chief economist. “While sales activity in Canada’s three westernmost provinces appears to have stopped deteriorating, it will be some time before supply and demand there becomes better balanced and the outlook for home prices improves.”
These imbalances are most keenly felt in the prairies and in Newfoundland and Labrador where CREA says the number of months of inventory “has swollen far beyond long-term averages”.
The opposite is occurring in Ontario and in the Maritimes, where very tight supply is heating up competition for buyers and putting upward pressure on home prices.
Price Growth by Region
British Columbia: Sales drag continues to pull prices lower in the province’s largest markets, down -9.6% in Greater Vancouver, -6.6% in the Fraser Valley, and -0.8% in the Okanagan Valley. However, they rose slightly in Victoria by 0.5%, and by 4.2% on the remainder of Vancouver Island.
Ontario: Prices continue to rise across the Greater Golden Horseshoe with Guelph experiencing the largest uptick, by 6.8%. That’s followed by Niagara Region (+6.7%), Hamilton-Burlington (+5.4%), the Greater Toronto Area (+3.6%), and Oakville-Milton (+3%). The Barrie and District markets were the only ones to see a decline, down -2.4%. However, the strongest price growth in the province is occurring in Ottawa, where home values surged by 8.3% year over year.
Prairies: CREA states, “…supply remains historically elevated relative to sales and home prices remain below year-ago levels.” This translated into a -3.9% drop in Calgary, -3.2% in Edmonton, -4% in Regina, and -1.1% in Saskatoon. It’s expected this trend will continue as long as these supply and demand imbalances linger.
Eastern Canada: Greater Montreal continues to be one of the strongest performing markets in the nation, as prices rose by 6.7%. Greater Moncton prices rose by 1.3%.