One year later, and it’s official: Ontario’s Fair Housing Plan, put in place last April to calm blistering home prices in Toronto, has effectively cooled the market. There’s no question that it’s a different reality today for both buyers and sellers, as the combative sellers’ conditions that defined the 2017 market have given away to balanced territory.
Both sales and home prices started to slide after the implementation of the FHP; the number of homes changing hands plunged 22.3 per cent by May 2017, as spooked sellers started to list en-masse, flooding the market with a 33.6-per-cent increase in listings. These double-digit declines have been a persistent trend over the following 12 months, with April 2018 numbers clocking in 31.1 per cent lower year over year, and the average price softening by 12.4 per cent to $804,584.
Related Read: 1 Year Later – Support Still Strong for Fair Housing Plan
Is It the Whole Picture?
However, while the number of sales, supply of new and existing inventory, and average sale price are commonly used metrics to measure housing market activity, they don’t tell the whole story regarding the total value of homes sold. Rather, this is calculated by determining the dollar volume, which represents the sum of the prices on all properties sold.
Determining the flow of dollars in a specific market can shed further light on activity and desirability in that neighbourhood.
So, following the anniversary of the game-changing Fair Housing Plan, how has dollar volume shifted throughout the City of Toronto? To find out, Zoocasa crunched the numbers in each of the city’s wards where at least 10 transactions have taken place over the last 12 months.
Check out the infographic below to see which areas experienced the greatest (and least) change in dollar volume since the introduction of the FHP.
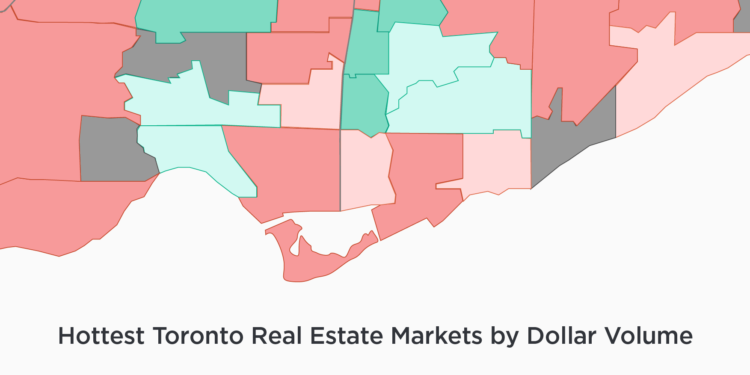
Hottest Toronto Real Estate Markets by Dollar Volume
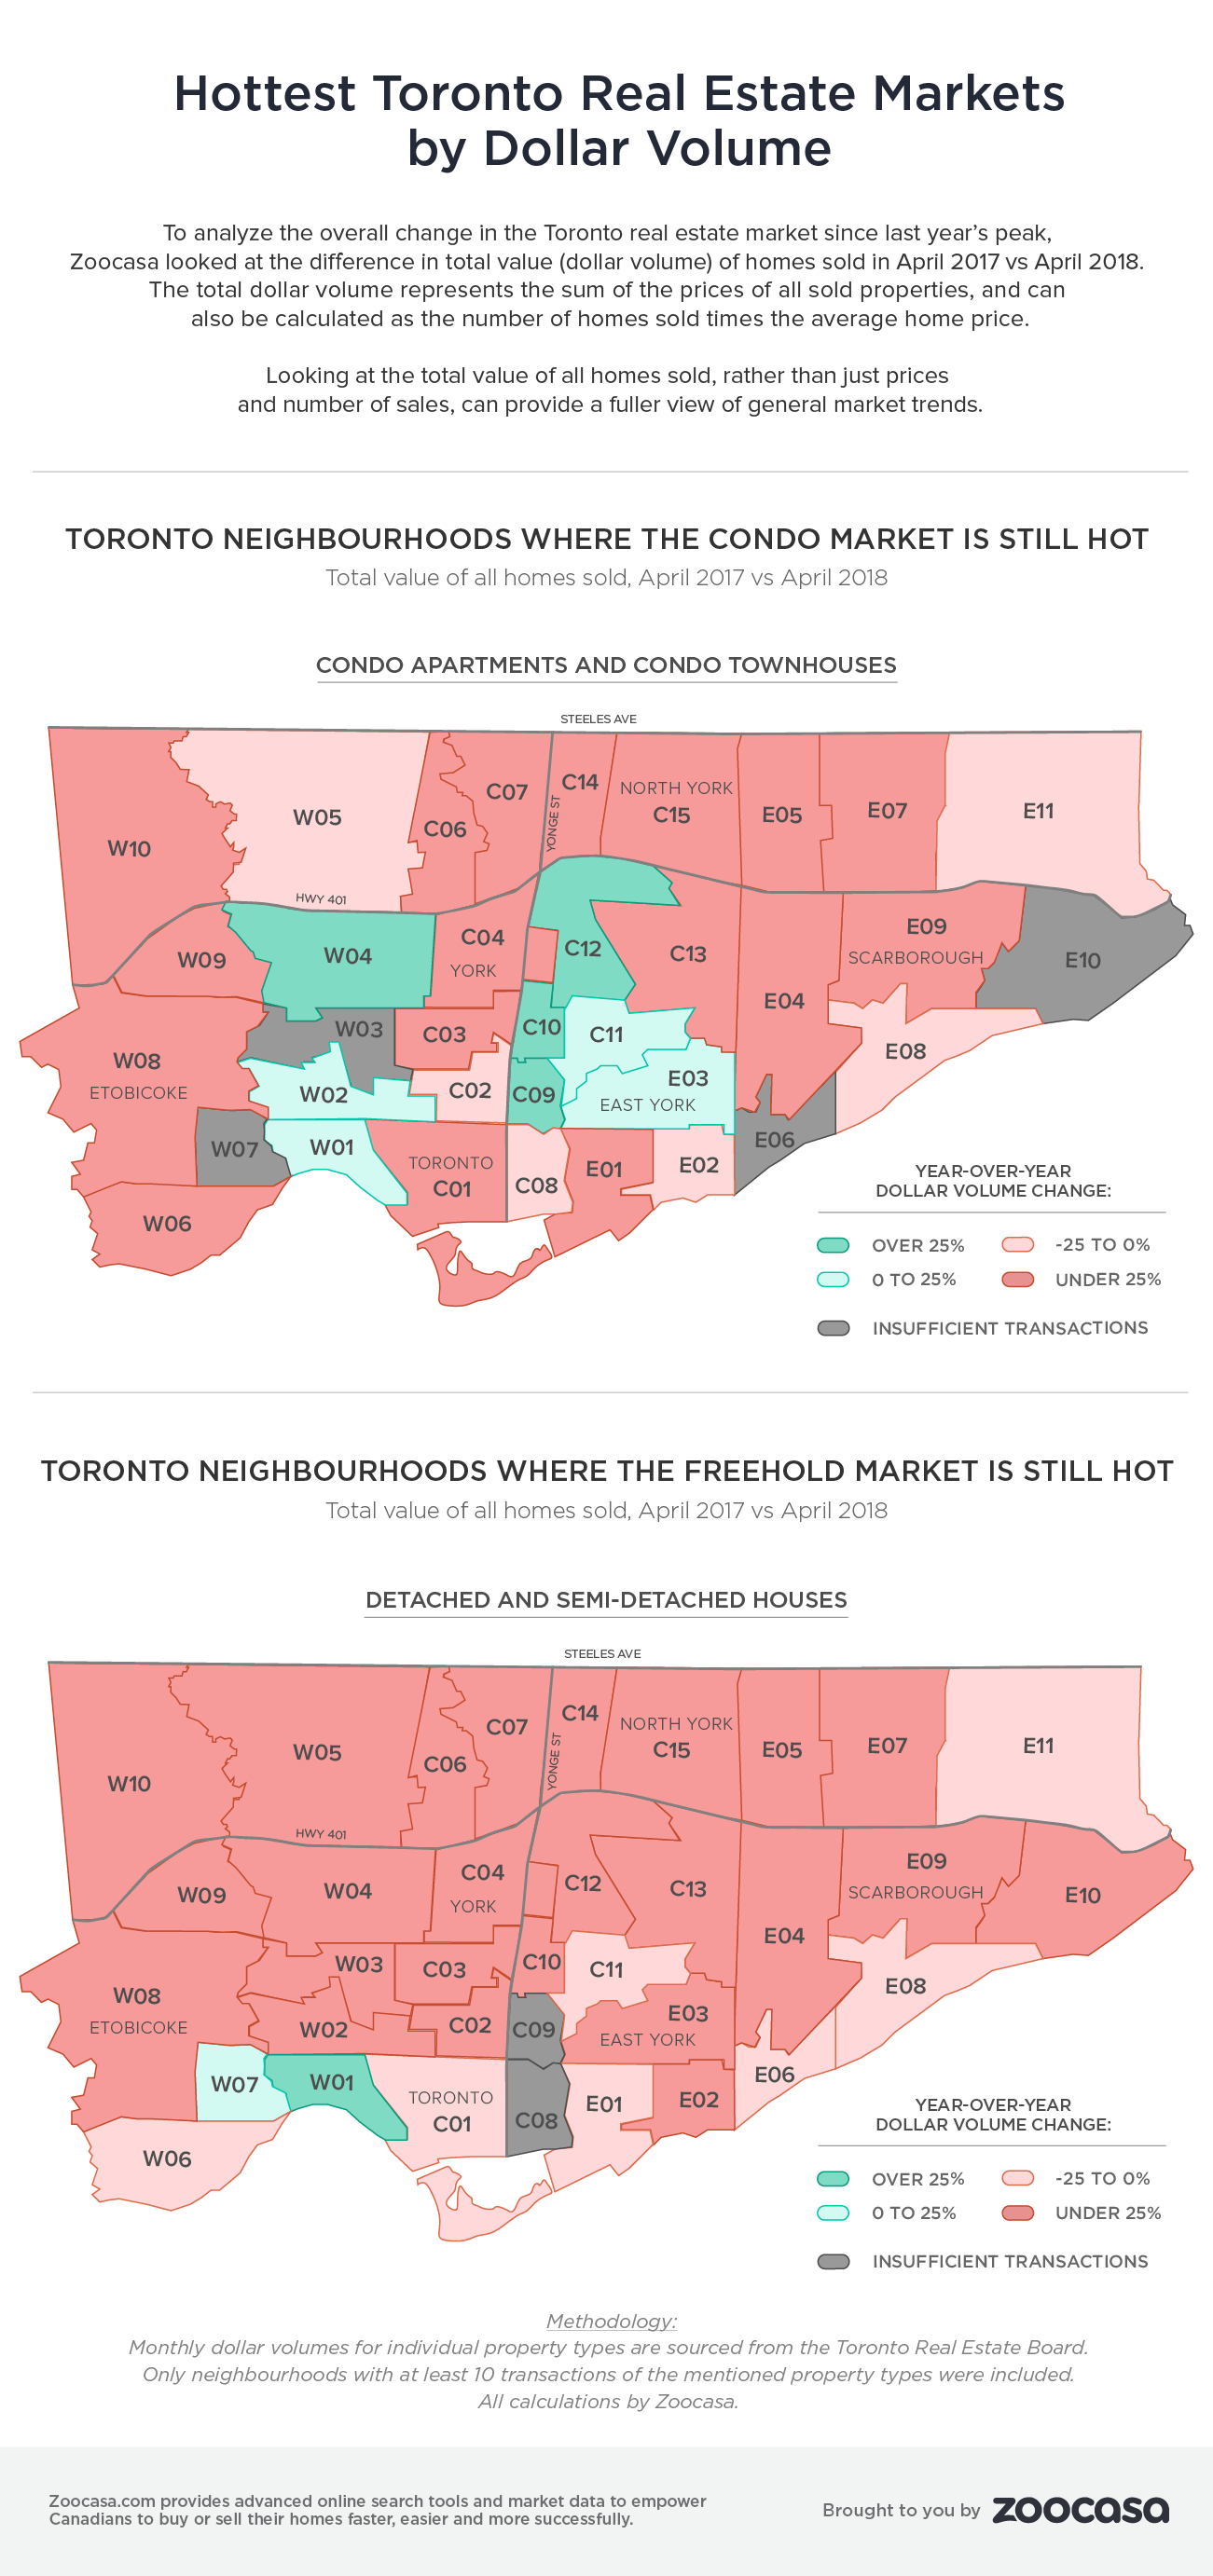
Hottest Condo Neighbourhoods by Dollar Volume
Neighbourhoods where the condo market has grown 25% or more since last year:
- C09 (Rosedale-Moore Park)
- C10 (Mount Pleasant East)
- C12 (Bridle Path, Hoggs Hollow, St. Andrew-Windfields)
- W04 (Yorkdale-Glen Park, Weston)
Neighbourhoods where the condo market has grown 0% to 25 % or more since last year:
- C11 (Flemingdon Park, Thorncliffe Park, Leaside)
- E03 (Danforth Village, O’Connor-Parkview)
- W01 (High Park-Swansea)
- W02 (Junction Area, High Park North)
Hottest House Neighbourhoods by Dollar Volume
Neighbourhoods where the freehold market has grown 25% or more since last year:
- W01 (High Park-Swansea)
Neighbourhoods where the condo market has grown 0% to 25 % or more since last year:
- W07 (Stonegate-Queensway)