It’s no secret that, as home prices surge in the Greater Toronto Area, prospective buyers are taking their real estate searches to further reaches of the Greater Golden Horseshoe region.
The City of Hamilton, located along the western shores of Lake Ontario and just an hour’s drive from Toronto’s downtown core, has seen particularly strong interest from home seekers.
Predicted in 2016 to be the province’s hottest market, the Hammer holds plenty of promise for new residents – long evolved beyond its industrial roots, it boasts a burgeoning “eds and meds”-based job market, and is well-serviced by regional transit. Nature enthusiasts have lots to love about this “city of waterfalls”, with close access to the region’s extensive hiking trails and gorges. Downtown, an emerging foodie scene rivalling Queen West satisfies locals, who also enjoy the city’s many unique neighbourhoods and close-knit, family-centric communities.
Related Read: Hamilton Home Prices Close to School Boundaries
Better Affordability Draws Hamilton Home Buyers
However the real charm for newcomers to the city is arguably affordability; freehold houses for sale in Hamilton went for an average of $549,546 in January. That’s an astounding $734,435 cheaper than what the average detached home sold for in the City of Toronto, at a price of $1,283,981.
And, alongside the rest of the GGH, Hamilton real estate has seen great value appreciation over the last few years – in fact, more than half of local neighbourhoods have seen prices rise more than 15 per cent as of 2016.
Which local Hamilton markets offer the greatest return on investment? To find out, Zoocasa crunched the annual price change for freehold properties by neighbourhood, over the last four years.
Check out the infographic below to see where buyers have accumulated the most value between 2014 – 2017.
The Top Appreciating Hamilton Neighbourhoods for Houses
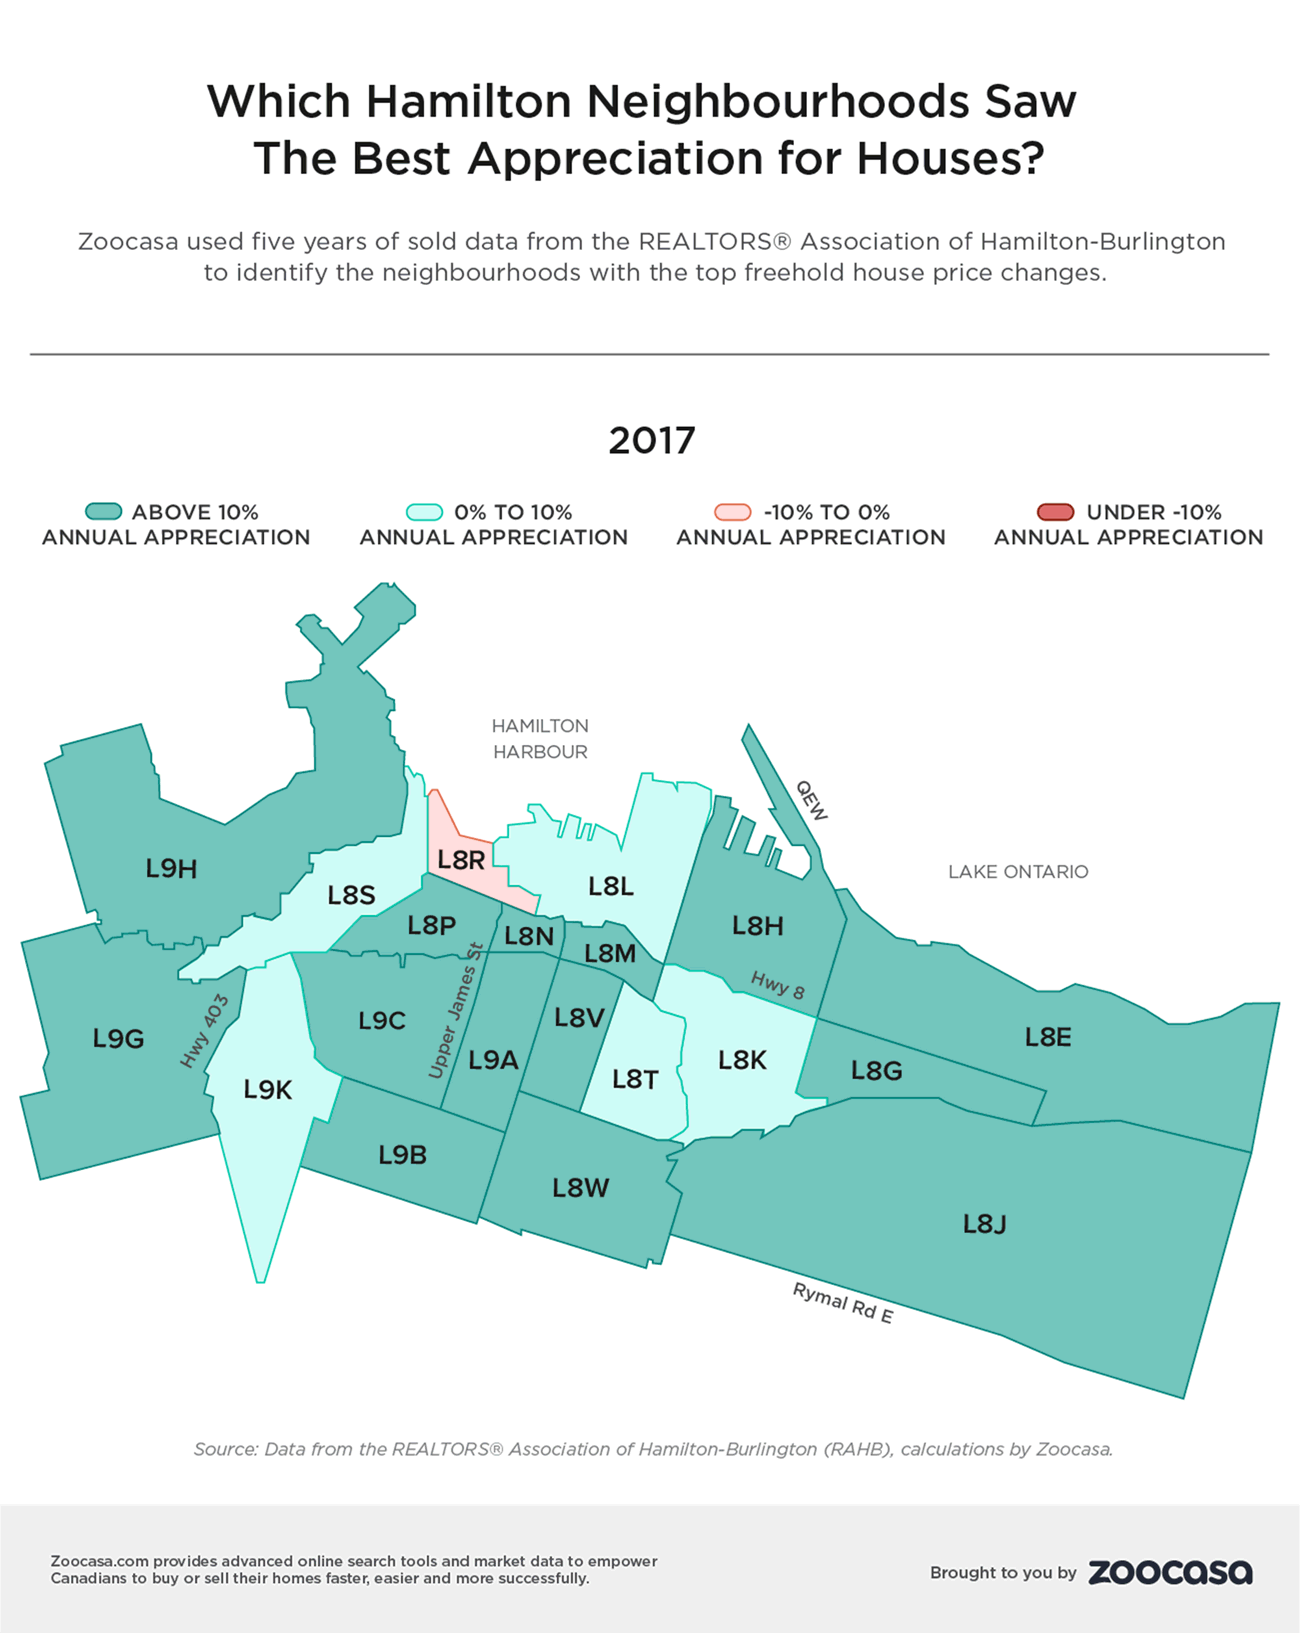
Neighbourhoods with Greatest Value Increase:
- L9G (Ancaster): Prices recovered from -10% depreciation in 2014 to over 10% appreciation in 2017.
- L8M (St. Clair, Blakeley, Delta West): Prices recovered from -10% depreciation in 2014 to over 10% appreciation in 2017.
Neighbourhoods with the Least Value Increase
- L8R (Strathcona, Central Hamilton): Prices declined from 0 – 10% in 2014, to -10 – 0% in 2017.
Neighbourhoods with Over 10% Appreciation Every Year, The Last 3 Years
- L8V (East Hamilton, Burkholme, Macassa)
- L9B (Carpenter, Barnstown, Kennedy West)
Neighbourhoods with Over 10% Appreciation Every Year, The Last 2 Years
- L8W (Quindale, Templemead, Randall)
- L9C (Westcliffe, Rolston, Gilkson, Mountview)
Neighbourhoods with Over 15% Appreciation, The Last Year
- L8E (Stoney Creek, Winona) – 28%
- L8P (Kirkendall North/South, Durand) 27%
- L8N (Corktown, Stinson) – 23%
- L9H (Highland Park Survey, Dundas) – 23%
- L8M (St. Clair, Blakeley, Delta West) – 19%
- L8J (Leckie Park) – 18%
- L9B (Carpenter, Barnstown, Kennedy West) – 18%
- L8G (Greenford, Cherry Heights, Fruitland) – 17%
- L8V (East Hamilton, Burkholme, Macassa) – 17%
- L8W (Quindale, Templemead, Randall) – 17%
- L9G (Ancaster, Oakhill, Nakoma) – 17%
- L9C (Westcliffe, Rolston, Gilkson, Mountview) – 16%
- L8H (Normanhurst, Crown Point East, McQuesten West) – 15%
Methodology: To find out which Hamilton neighbourhoods saw the greatest price appreciation, Zoocasa calculated the annual price change of freehold properties by neighbourhood (postal code/FSA) for the last four years to identify the areas with the highest and most consistent appreciation for houses.
The average price is based on the full year of data for 2013, 2014, 2015, 2016 and 2017. The price change for 2018 (i.e. 2017 to 2018) is not included due to too few transactions year-to-date to calculate reliable average prices.