
What is it like to be a home buyer in one of Canada’s major housing markets? According to the latest numbers released by the national real estate body, current conditions for the country as a whole are stable, yet primed for growth – June sales remained roughly unchanged from last year, edging up 0.3%, according to the Canadian Real Estate Association.
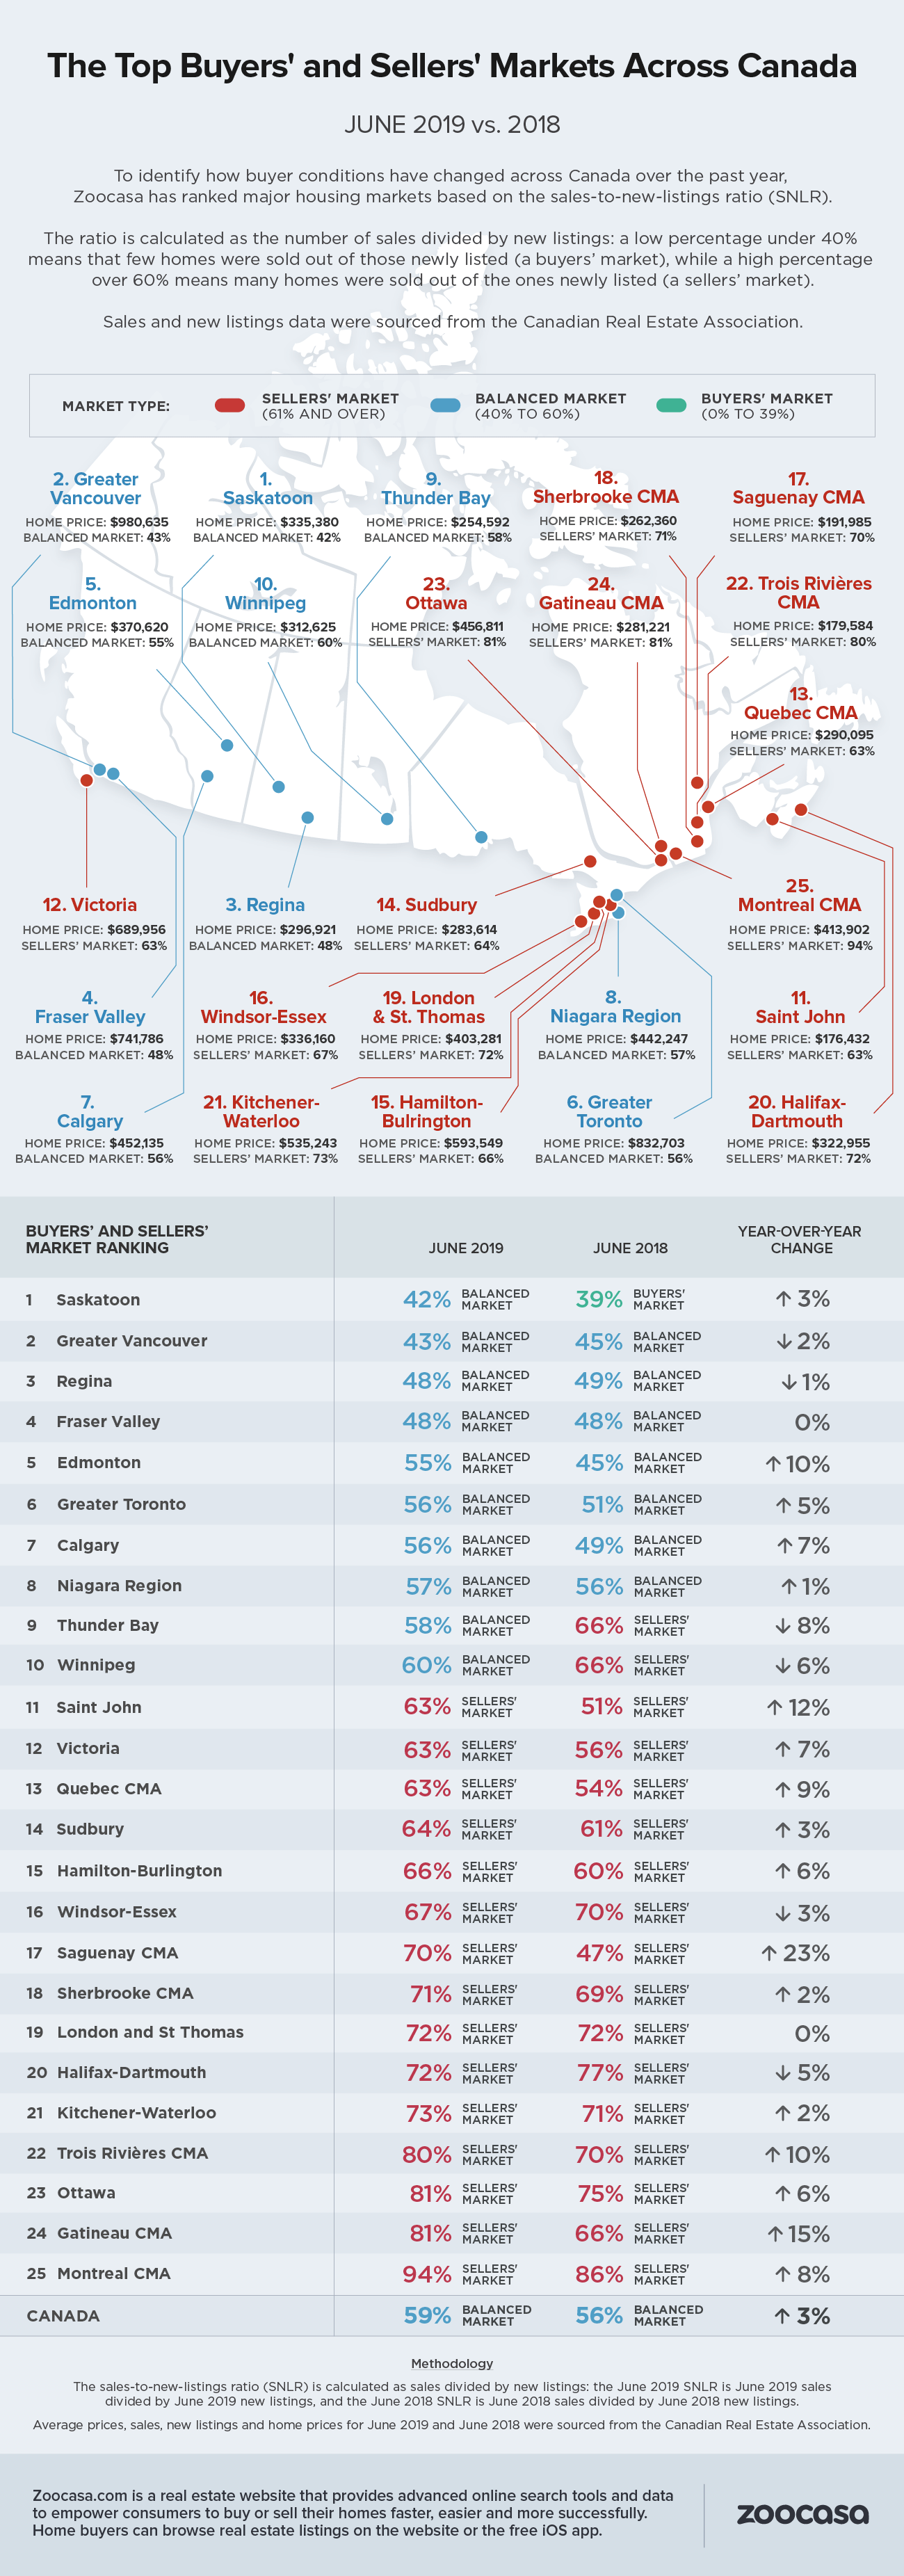
Overall, the Canadian real estate market is considered to be balanced, though it’s creeping closer to sellers’ territory. According to new calculations of non-seasonally adjusted June sales and new listings data by Zoocasa, the national sales-to-new-listings ratio (SNLR) hit 59% last month, up from 56% the year before. This ratio, which is used to measure the level of competition in a housing market, is calculated by dividing the number of sales by the number of new listings over the course of the month. A resulting percentage between 40 – 60% indicates a balanced market, while above and below that threshold reveals sellers’ and buyers’ markets, respectively.
Buying Conditions Differ Dramatically Across Canada
From a national perspective, the June SNLR translates to just enough supply to meet demand, providing a firm foundation for market prices, yet still preventing the kind of competitive factors that lead to overheating values.
However, the conditions experienced by home buyers and sellers at the local level can be very different as supply and demand imbalances in the western and eastern provinces mean some housing markets remain in the doldrums, while others are downright frothy.
According to the data, none of the 25 markets analyzed can be considered to be a classic buyers’ market – defined by having a sales-to-new-listings ratio of 39% and below – while 15 can be classified as sellers’ markets. A total of 10 remain balanced.
Higher-Priced Markets Experiencing Slower Conditions
While the SNLR can shed light on how competitive each market is for buyers, it doesn’t necessarily indicate affordability. For example, an individual looking to purchase a home in a city that’s classified as a buyers’ market will likely enjoy
An example of this dynamic can be seen in the Greater Vancouver market, which, with an SNLR of 43%, can be considered on the softer end of balanced. This reflects a drastic -15% drop in sales and -10.6% decline in additions to the Vancouver MLS, as a combination of provincial policies, the national mortgage stress test, and price fatigue effectively cooled the market. However, while the average home price in the region has softened by -8.2% to $980,635, that remains out of affordable range for many prospective buyers, despite its status as a balanced market.
Conditions are considerably friendlier for sellers in the Greater Toronto real estate market; with an SNLR of 56%, it can still be considered to be balanced, but a 9.6% increase in sales coupled with a -0.7% decline in new listings has pushed it closer to sellers’ territory, with prices inching up by 3.1% to an average of $832,703.
Hottest Sellers’ Markets in $500K-Range
In fact, the hottest sellers’ markets in June are in comparatively more affordable markets, with an average home price below $500,000.
Topping the list is Montreal with a searing SNLR of 94%, indicating the vast majority of supply brought to market is changing hands. Home sales in the city are up by 7% compared to the same month in 2018 while new listings dipped by -1.4%, which has heated competition between buyers. As a result, the average home price has surged by 6.3% year over year to $413,902 – still considerably lower than in Canada’s other large urban markets.
That brisk demand extended west of the city into the Ottawa corridor as the Gatineau CMA and Ottawa both boasted SNLRs of 81%, reflecting sales upticks of 7% and 1.5%, while new listings fell by -13.4% and -6.2% in each. The average home price in each city came to $281,221 and $456,811 in June, respectively.
Check out the infographic below to see which housing markets were most and least competitive in June, and how they compared to the same time period in 2018.
Methodology
The sales-to-new-listings ratio (SNLR) is calculated as sales divided by new listings: the June 2019 SNLR is June 2019 sales divided by June 2019 new listings, and the June 2018 SNLR is June 2018 sales divided by June 2018 new listings. Average prices, sales, new listings and home prices for June 2019 and June 2018 were sourced from the Canadian Real Estate Association.
About Zoocasa
Zoocasa.com is a real estate website that provides advanced online search tools and data to empower consumers to buy or sell their homes faster, easier and more successfully. Home buyers can browse real estate listings on the website or the free iOS app.